Databend's OpenTelemetry Exporter Turns Logs, Traces, and Metrics into SQL Queryable Tables
Introduction: Why has a payment request become slow, and how much money do failed orders involve? After connecting OpenTelemetry's logs, traces, and metrics to Databend Cloud, data engineers can use familiar SQL to gradually investigate these issues. This article uses an e-commerce demo to demonstrate the entire process from data ingestion, call chain reconstruction, and business impact analysis, and discusses why a cloud-native lakehouse is suitable for carrying such data.
Troubleshooting a payment failure starts with finding the error log, but that's only the beginning. You also need to look along the call chain to see where time was spent, and then confirm which orders were affected by the failed requests. If logs are in Elasticsearch or Loki, traces in Jaeger or Tempo, and metrics managed by Prometheus, this information has to be cross-referenced across different systems. To further analyze business impact, data engineers must associate observability data with order data, adding the work of exporting data, cleaning up fields, and joining tables.
OpenTelemetry (referred to as OTel) provides a unified specification for collecting and transmitting logs, traces, and metrics. Applications generate data via SDKs or automatic instrumentation, send it via the OTLP protocol to the Collector, which then processes and exports it. Where the data ultimately resides, how to query across signals, and how to correlate with business tables still need to be addressed by the backend.
Lakehouses and analytics databases are also moving in this direction, integrating observability data. For teams already using Databend for data analysis, connecting OTel data into their existing lakehouse allows them to continue using familiar SQL queries, and, if business tables are already stored, directly analyze the relationship between failures and orders.
Databend offers the OpenTelemetry Collector exporter to handle this integration, writing logs, traces, and metrics as three regular tables. Below, we use an actual demo on Databend Cloud to see how this path works. All screenshots, animations, and videos in this article come from this demo. The application and order data are generated by a simulator, and the query results shown are from actual runs.
Integration Principles and Data Structure
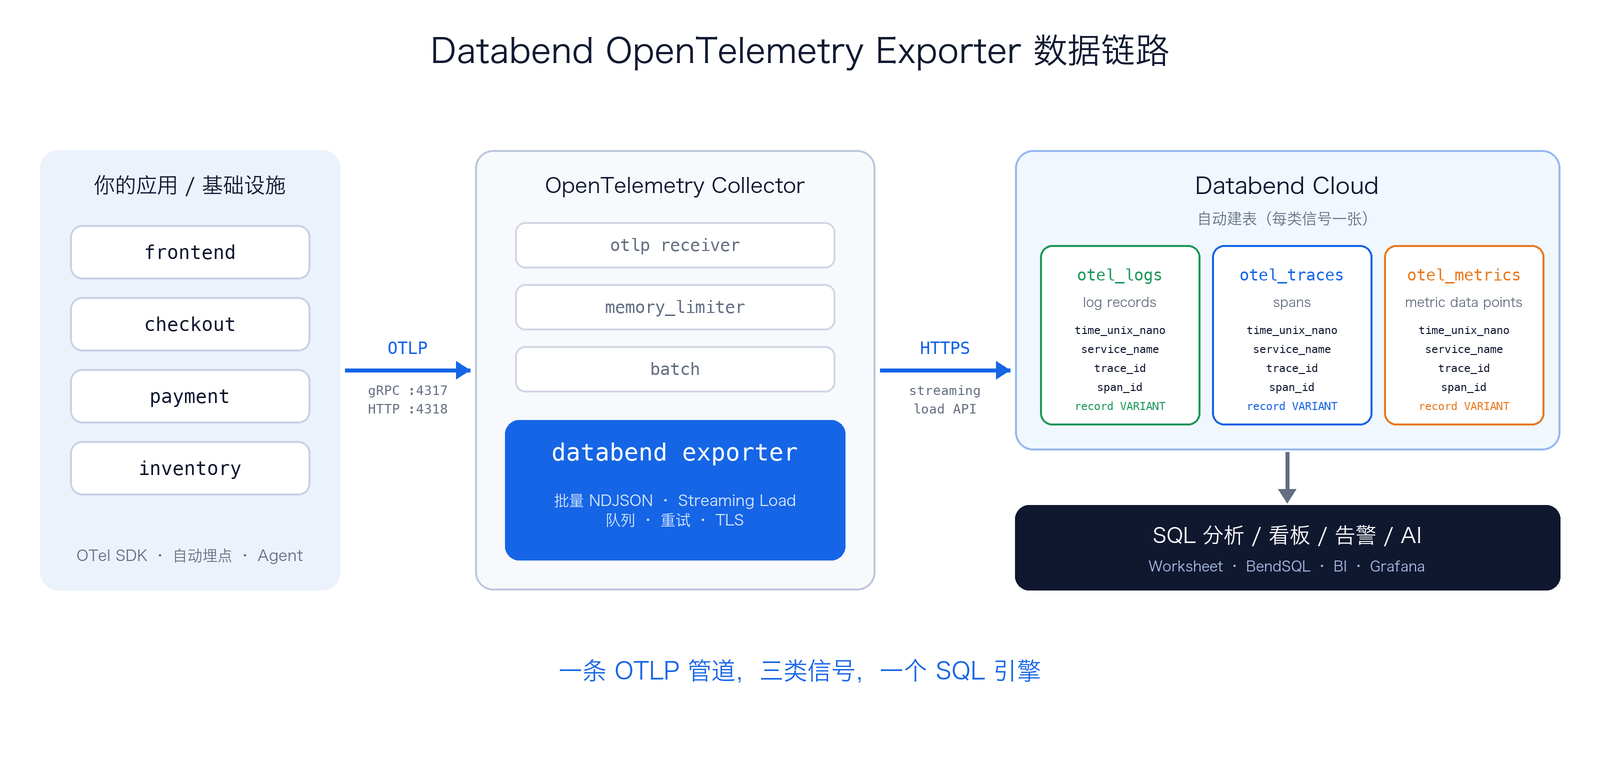
Data passes through three steps from application to query:
The application uses the OTel SDK or automatic instrumentation to send data via OTLP to the Collector.
The
databendexporter in the Collector encodes each batch of data as NDJSON and writes it via Databend's native HTTP Streaming Load interface.The data lands in three tables:
otel_logs,otel_traces, andotel_metrics, which can be queried with SQL in the Worksheet, BendSQL, BI tools, or Grafana.
The exporter is designed with the following aspects regarding write methods and data retention:
Writes via Databend's native interface. The exporter directly calls Databend's /v1/streaming_load, uploading each batch once, without requiring SQL literal concatenation or additional drivers.
Supports all three signal types and five metric types. Gauge, sum, histogram, exponential histogram, and summary can all be written, with details such as exemplars, bucket boundaries, min/max, and percentiles preserved.
Data is preserved as-is, without lossy flattening. Each row is a log entry, a span, or a metric data point. Commonly filtered fields (time, service name, trace_id, span_id, name, metric type) are separate columns, while the complete OTLP object is stored in a VARIANT-type record column. Attribute types, span events and links, status, and dropped counts are all retained.
Timestamps are precise to nanoseconds. Databend's TIMESTAMP uses microsecond precision, so UInt64 is used to store raw nanosecond values; 64-bit integers also avoid precision loss from float64 conversion.
Reliability via Collector's standard capabilities. The sending queue (configurable persistent storage), retry with backoff, timeouts, TLS, and authentication extensions all reuse the Collector's exporterhelper and confighttp, configured in the same way as other exporters.
Supports automatic table creation, or can be configured with minimal permissions. By default, create_schema: true automatically creates database and tables at startup. In production, an administrator can pre-create tables using schema.sql from the repository, giving the exporter account only INSERT privileges and setting create_schema: false.
Running the Demo: Writing Three Types of Data to Databend Cloud
The demo code, full configuration, and reproduction steps are available in the Demo Notes. Below, we follow the order of connecting, compiling, starting, and sending data. You can also watch this approximate 50-second terminal demo:
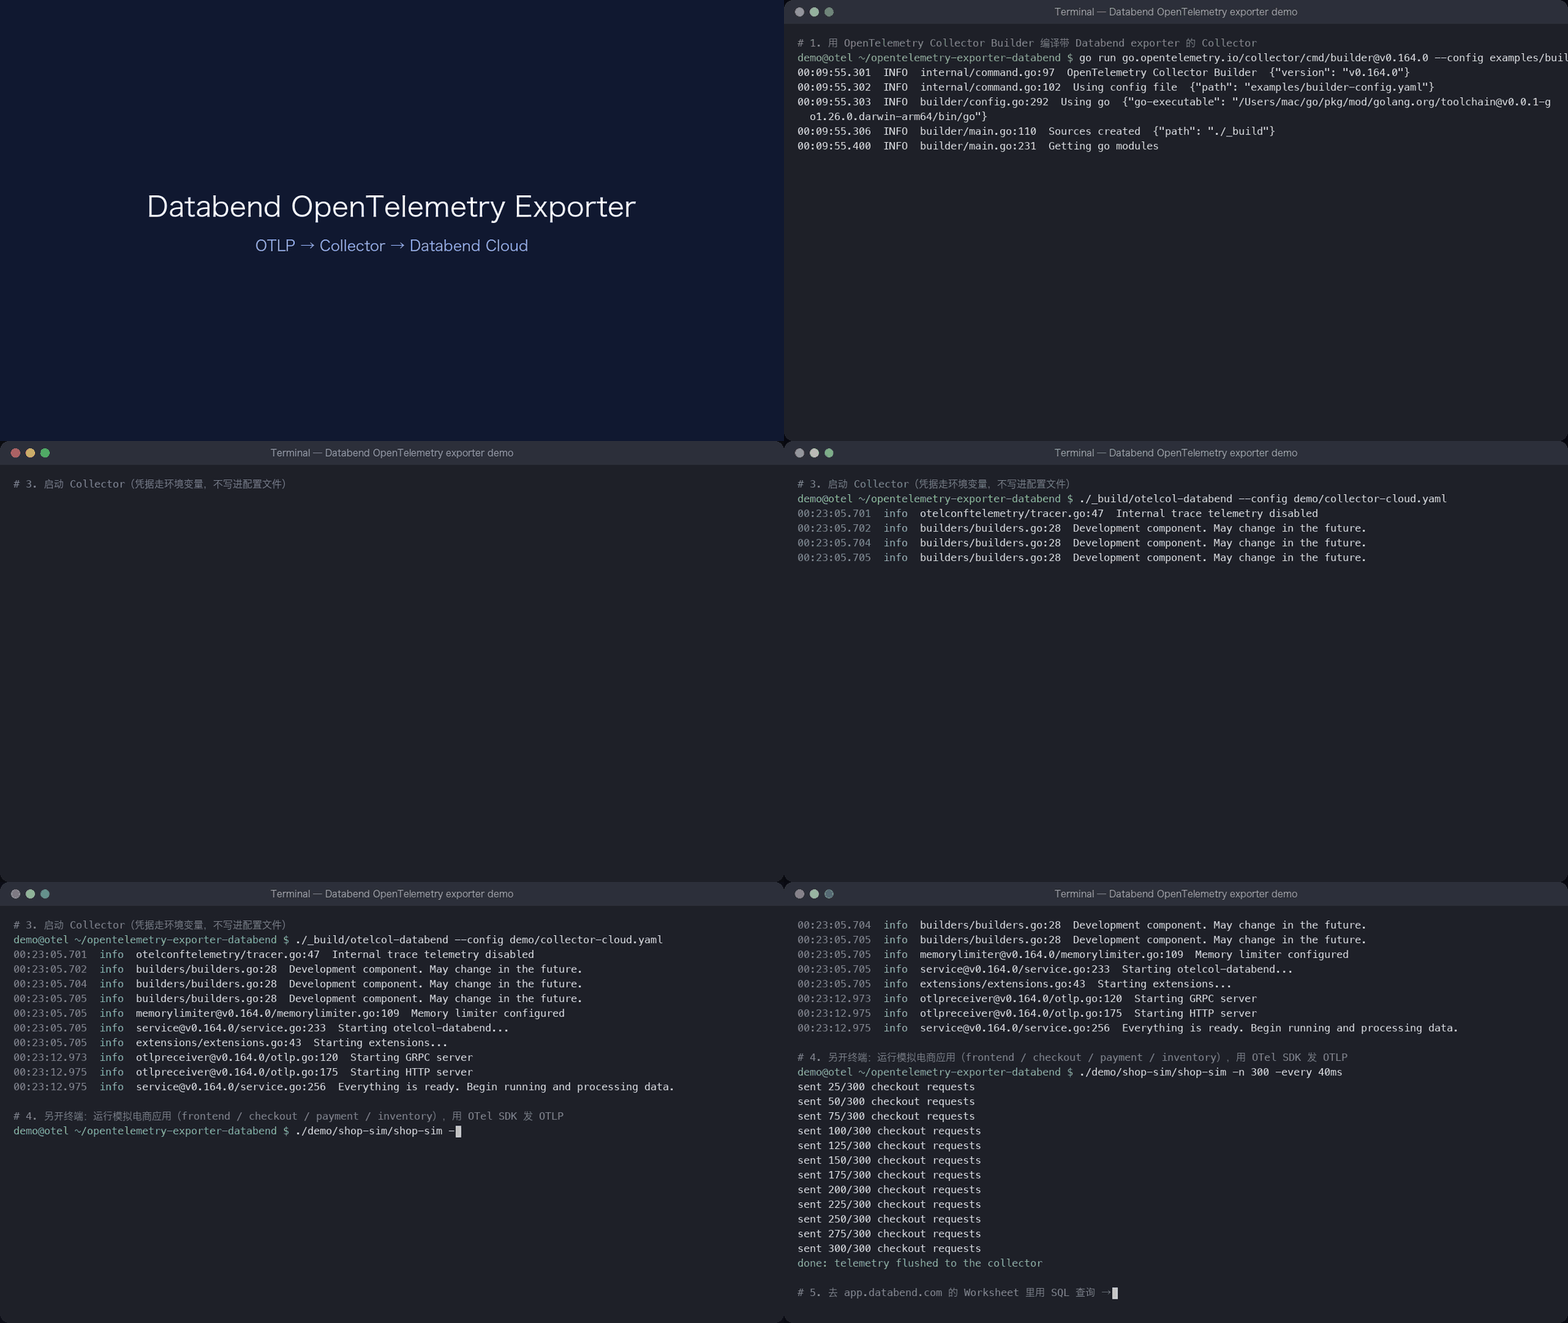
Step 1: Get Connection Information
Log in to app.databend.com, click Connect in the top right corner. The exporter needs the Host (format: <tenant>.gw.<region>.default.databend.com) and Warehouse.
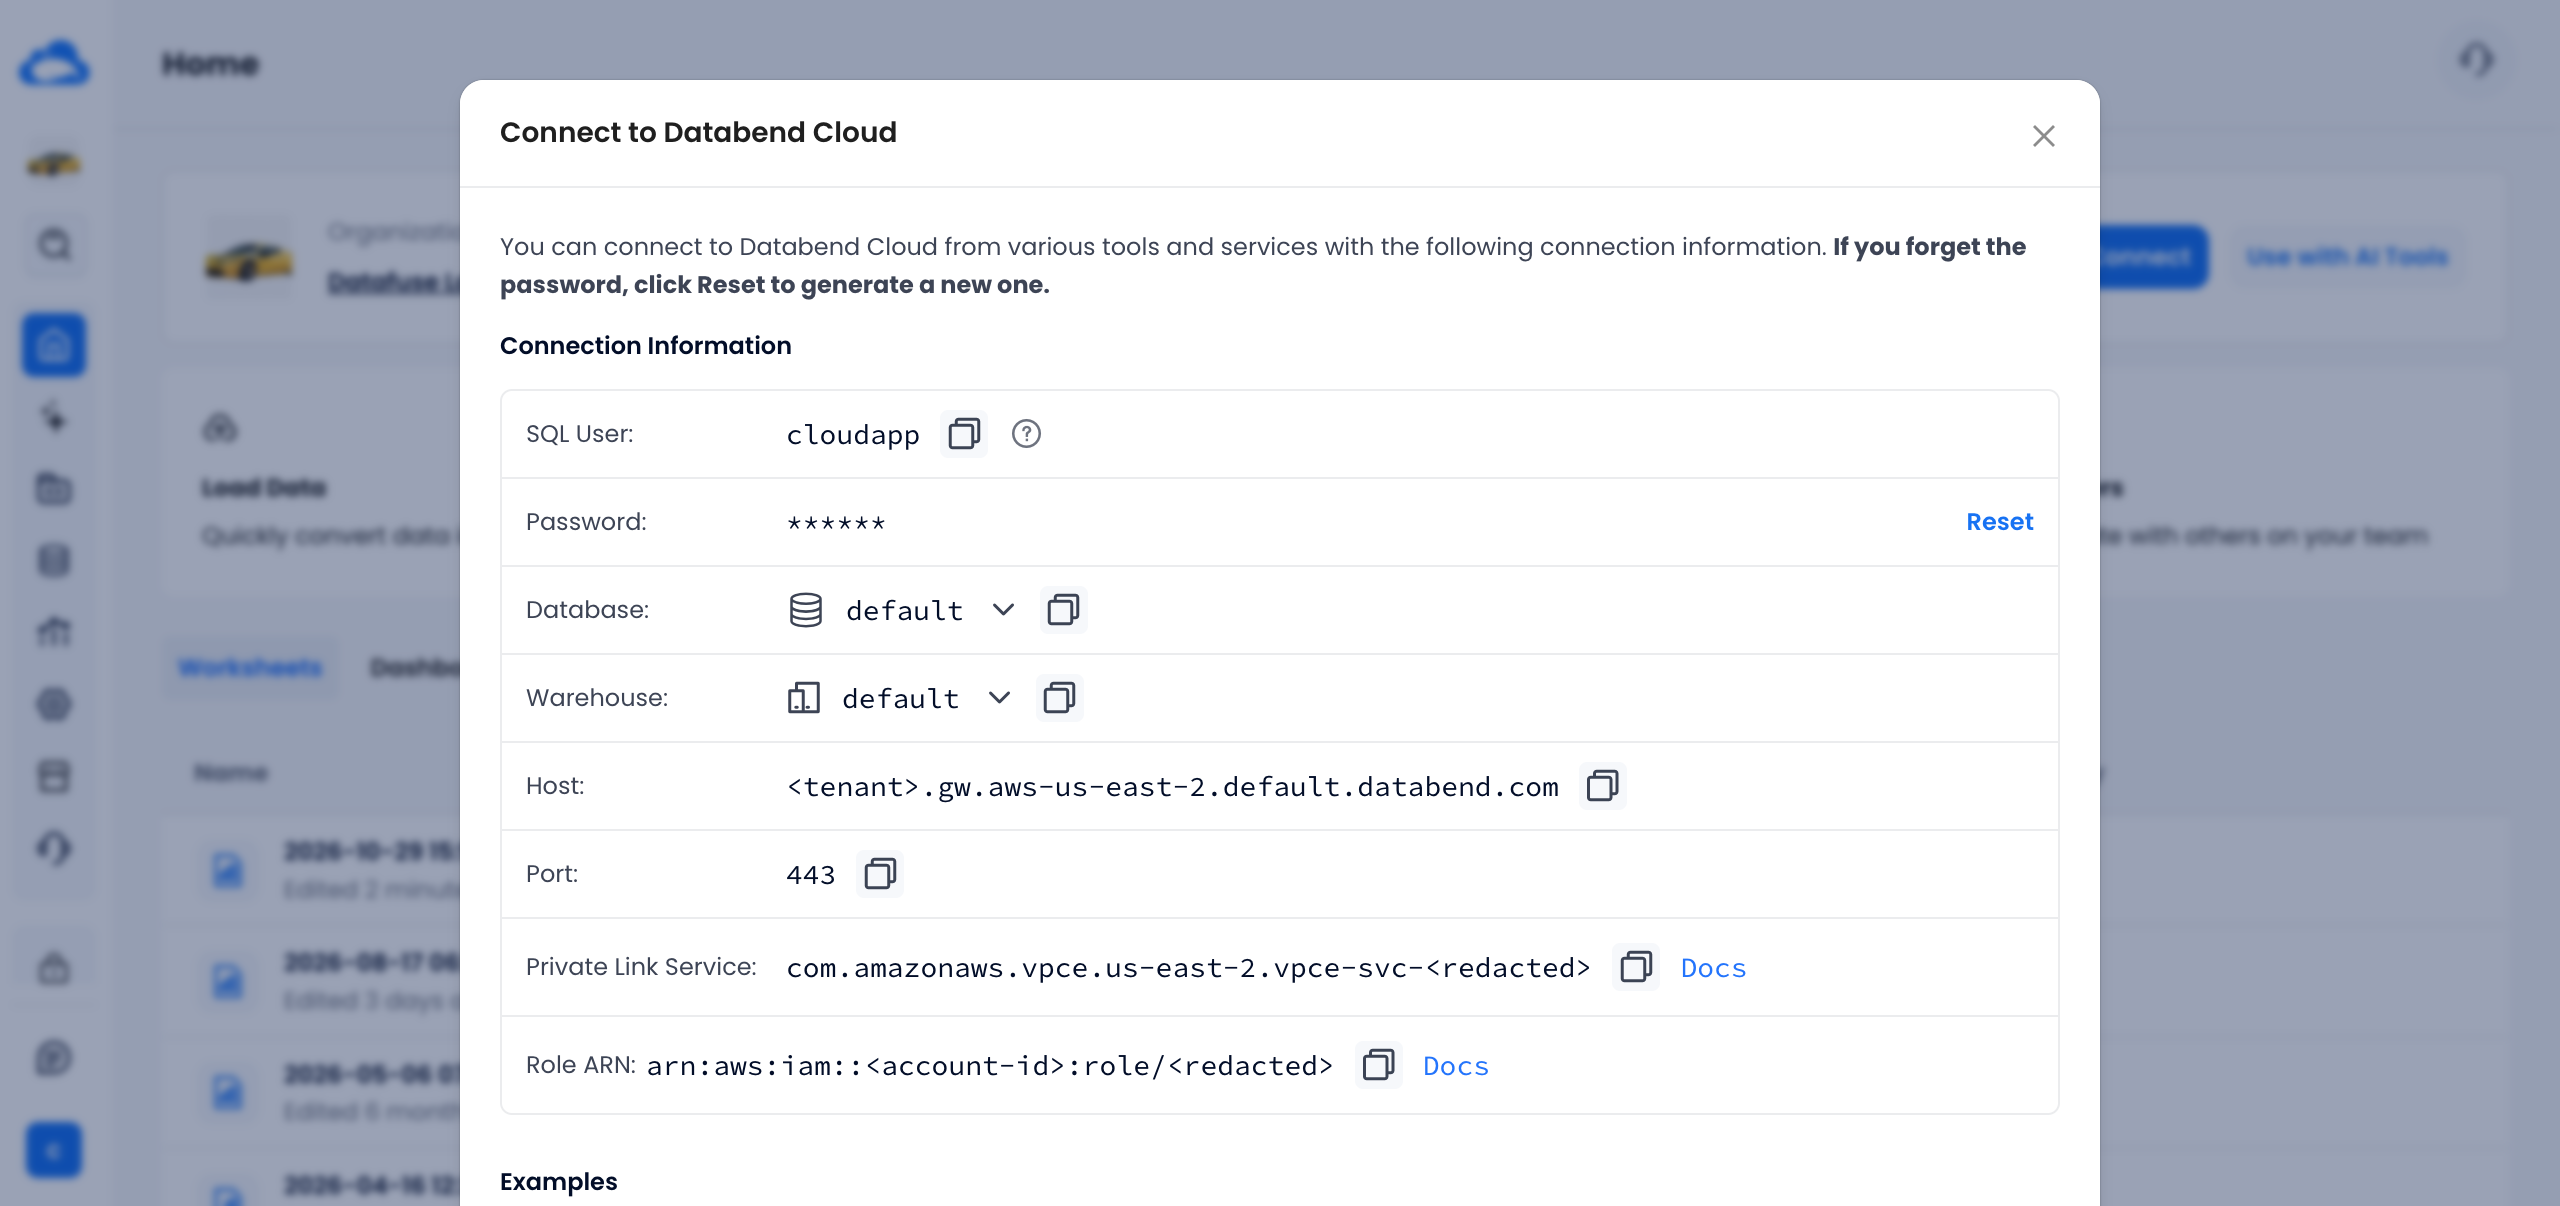
The tenant information in the screenshot is blurred.
It is recommended to create a dedicated user for the exporter, not use an admin account. Execute the following SQL in the Worksheet:
CREATE ROLE otel_exporter_demo_role;
-- Only needed when create_schema: true
GRANT CREATE DATABASE ON *.* TO ROLE otel_exporter_demo_role;
CREATE USER otel_exporter_demo IDENTIFIED BY '<strong password>'
  WITH DEFAULT_ROLE = 'otel_exporter_demo_role';
GRANT ROLE otel_exporter_demo_role TO otel_exporter_demo;
Step 2: Compile a Collector with the Databend Exporter
The exporter used in this demo is not yet included in the official OpenTelemetry Collector Contrib distribution, so you need to build a custom Collector using the OpenTelemetry Collector Builder (ocb). The repository provides a builder configuration:
git clone https://github.com/databendlabs/opentelemetry-exporter-databend
cd opentelemetry-exporter-databend
go run go.opentelemetry.io/collector/cmd/[email protected] \
  --config examples/builder-config.yaml
## Output: ./_build/otelcol-databend
Go 1.26 or higher is required. If you already have your own Collector distribution, simply add the exporter to the exporters section of your builder config.
Step 3: Configure and Start the Collector
The main exporter and pipeline configuration is shown below; the full configuration is in the docs at https://github.com/databendlabs/opentelemetry-exporter-databend/tree/main/examples:
exporters:
  databend:
    endpoint: ${env:DATABEND_ENDPOINT}     # https://<Host>
    username: ${env:DATABEND_USERNAME}
    password: ${env:DATABEND_PASSWORD}
    headers:
      X-Databend-Warehouse: ${env:DATABEND_WAREHOUSE}
    database: otel_demo
    create_schema: true
    sending_queue:
      enabled: true
    retry_on_failure:
      enabled: true

service:
  pipelines:
    logs:    { receivers: [otlp], processors: [memory_limiter, batch], exporters: [databend] }
    traces:  { receivers: [otlp], processors: [memory_limiter, batch], exporters: [databend] }
    metrics: { receivers: [otlp], processors: [memory_limiter, batch], exporters: [databend] }
Credentials are injected via environment variables, so they don't need to be written into the config file:
export DATABEND_ENDPOINT=https://<tenant>.gw.aws-us-east-2.default.databend.com
export DATABEND_USERNAME=otel_exporter_demo
export DATABEND_PASSWORD='<strong password>'
export DATABEND_WAREHOUSE=default
./_build/otelcol-databend --config collector-cloud.yaml
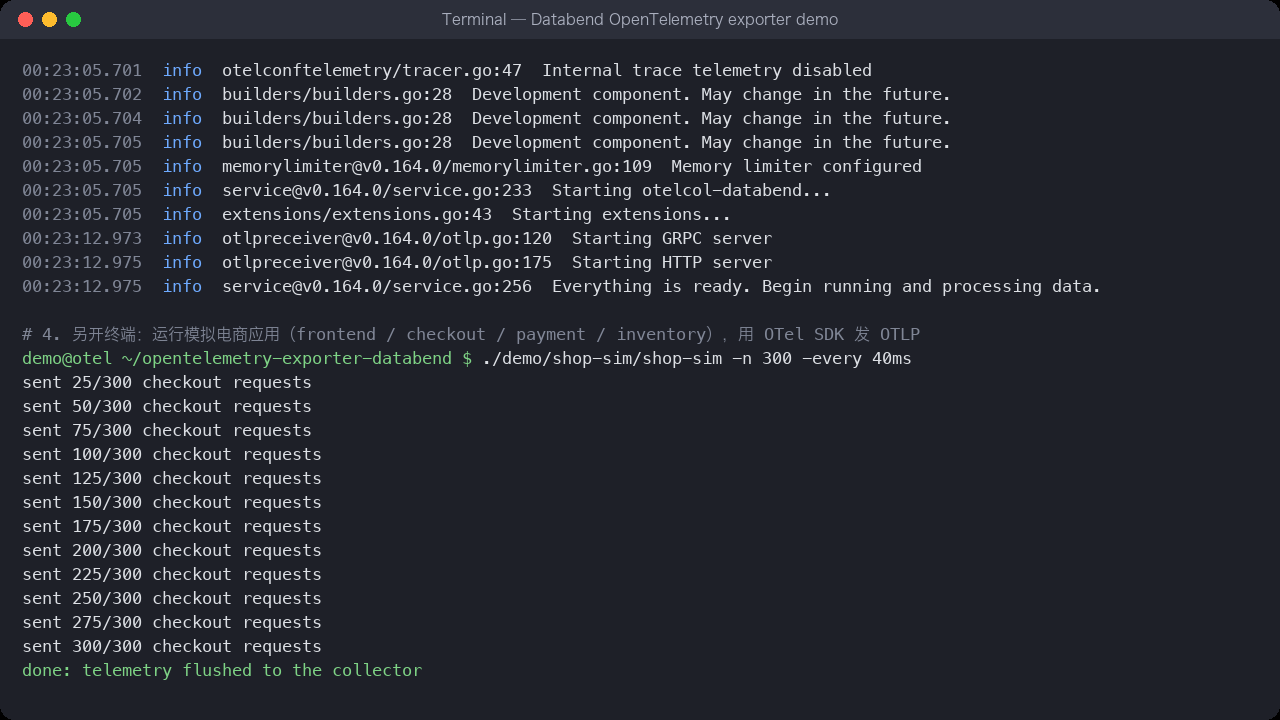
In this demo, after seeing Everything is ready. Begin running and processing data., the Collector is up and the exporter has connected to Databend Cloud, creating the three tables.
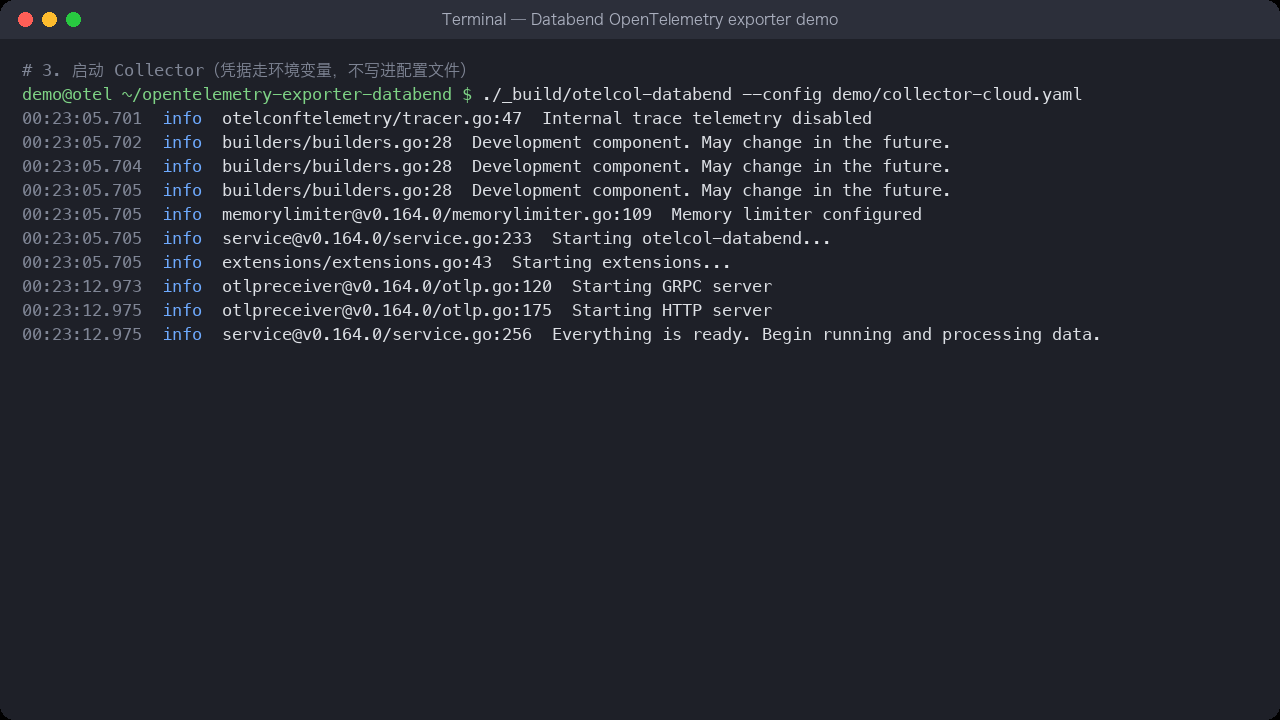
Step 4: Send Data and Confirm Ingestion
You can send data using any program that supports OTLP. The local receive address is 127.0.0.1:4317 (gRPC) or 127.0.0.1:4318 (HTTP). Services already instrumented with OTel can set OTEL_EXPORTER_OTLP_ENDPOINT to the Collector address for the corresponding protocol.
The demo uses a simulated e-commerce application where one checkout request sequentially passes through four services: frontend, checkout, inventory, and payment. Approximately 8% of requests fail at the payment stage (card declined), and about 10% of payment times exceed 400 ms. It uses the official OTel Go SDK to report traces, logs, and metrics simultaneously.
Back in the Worksheet, you can see that data has been written into the three tables:
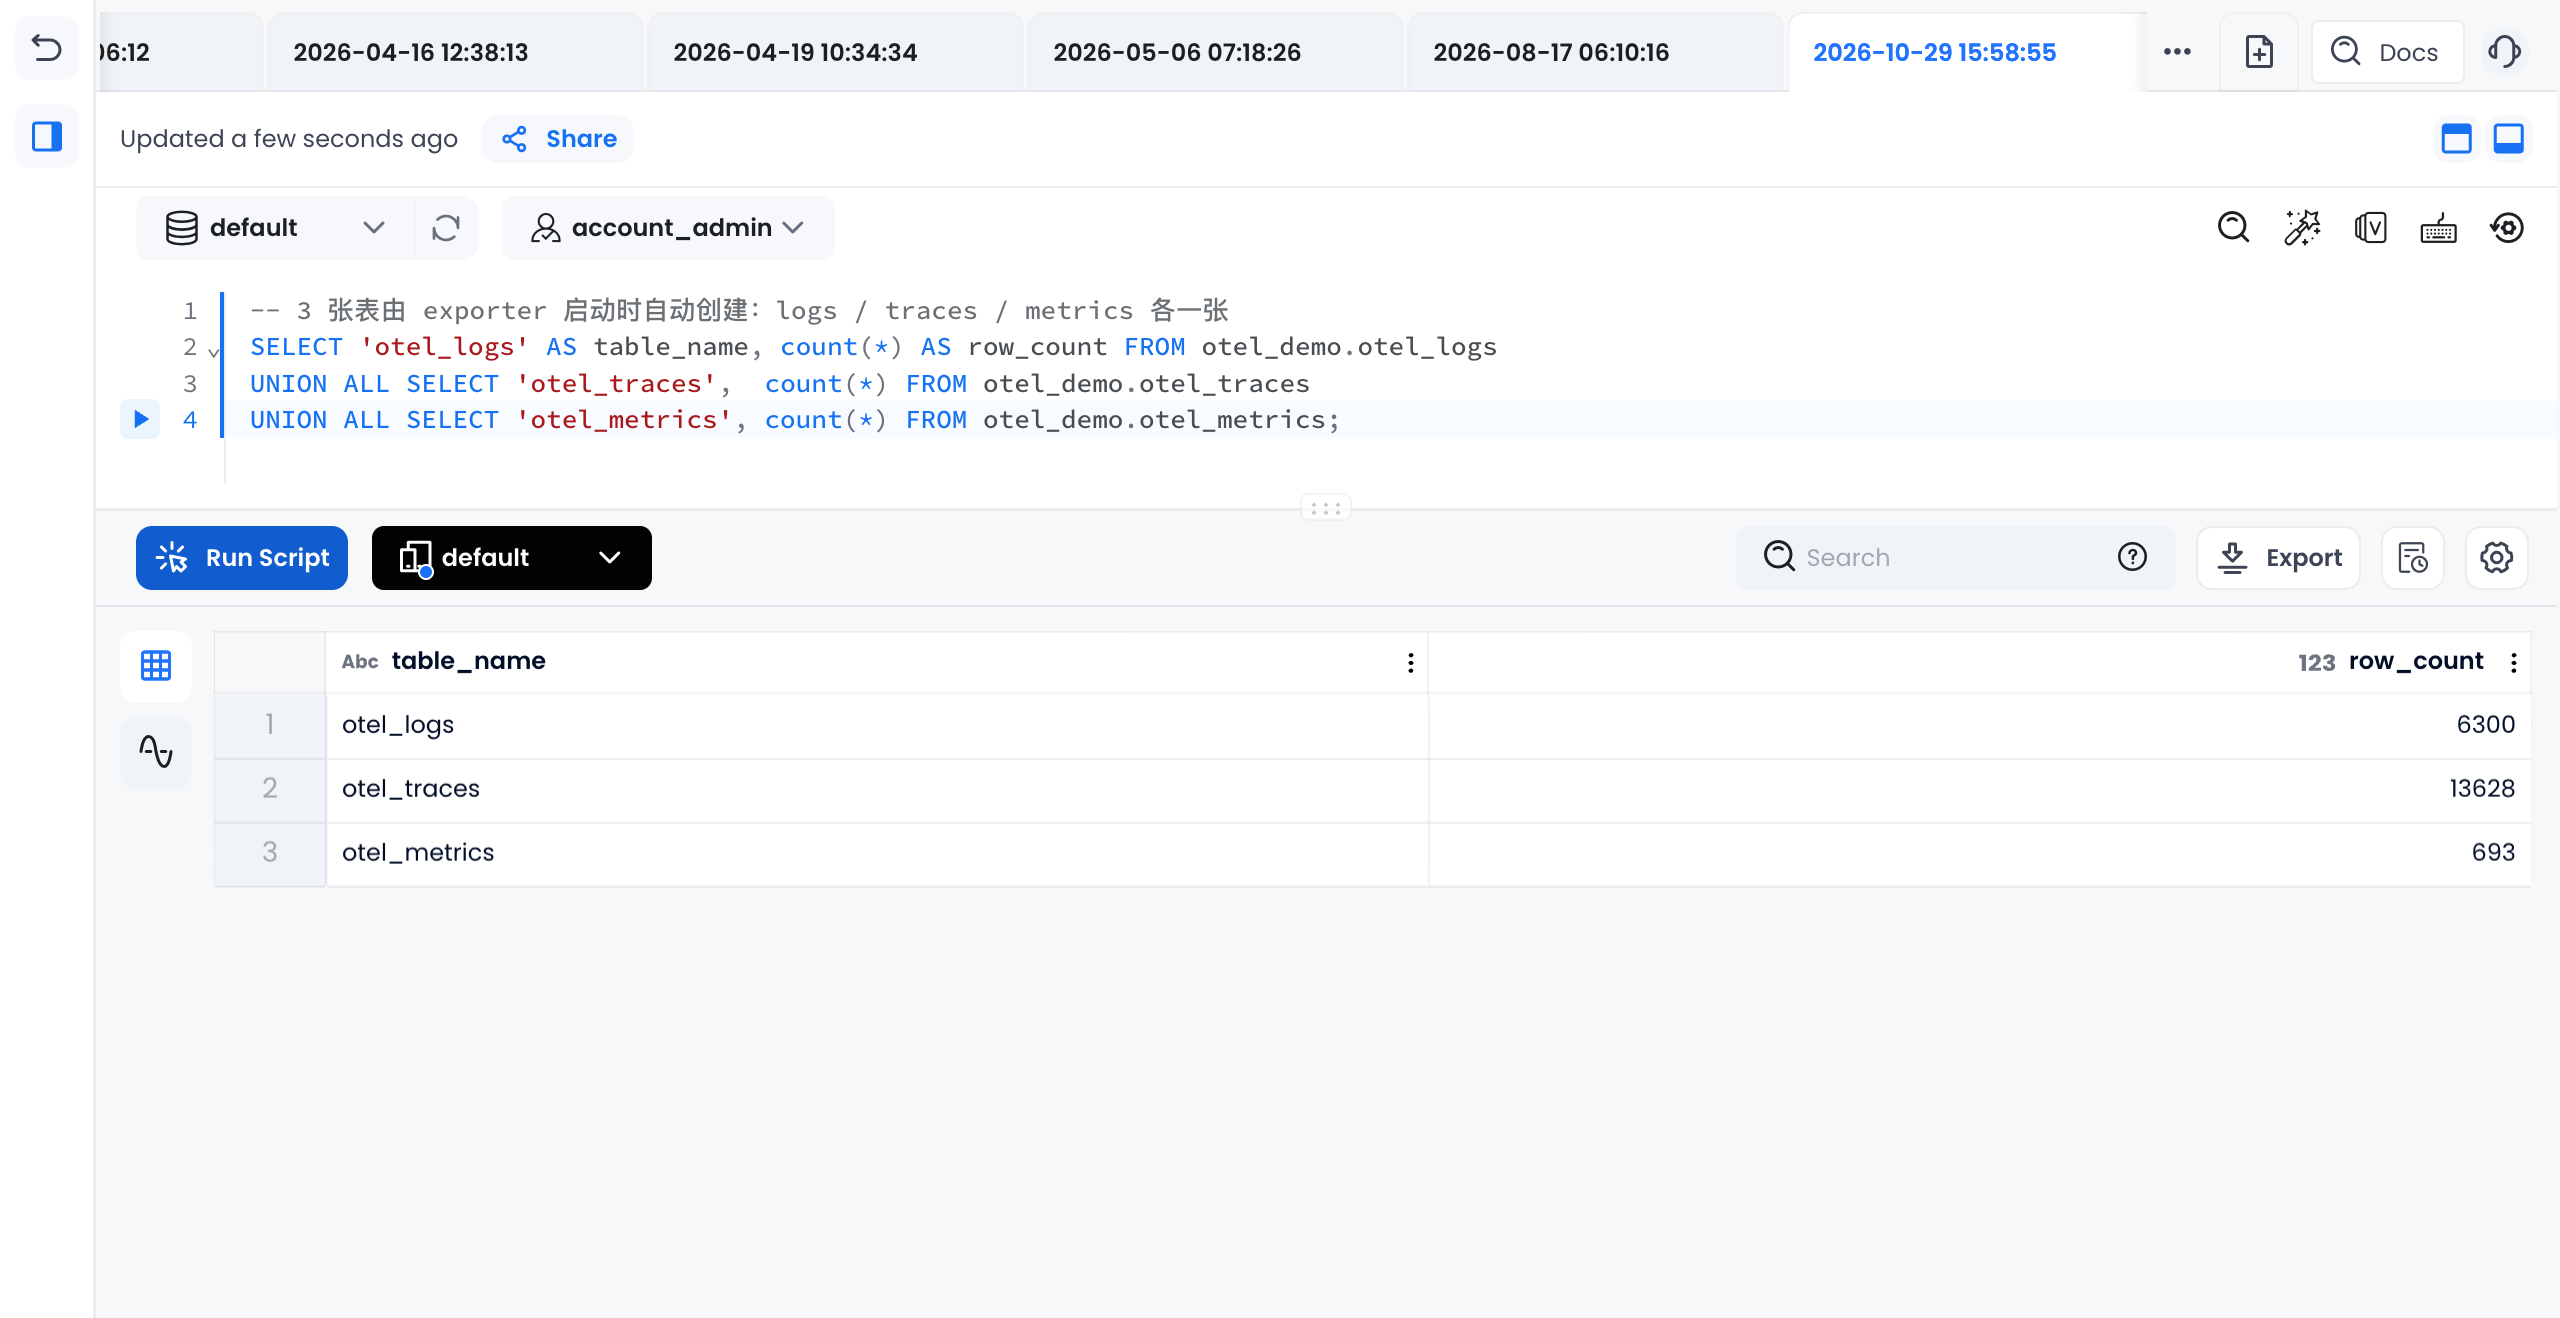
This simulation performed 2,100 checkouts, writing 6,300 logs, 13,628 spans, and 693 metric data points. During this run, the Collector logged no errors or warnings.
Using SQL to Troubleshoot Payment Failures and Analyze Order Impact
Once data is written, you can query it in the Worksheet. Start with error logs, then reconstruct the call chain via trace_id. The animation below shows this process:
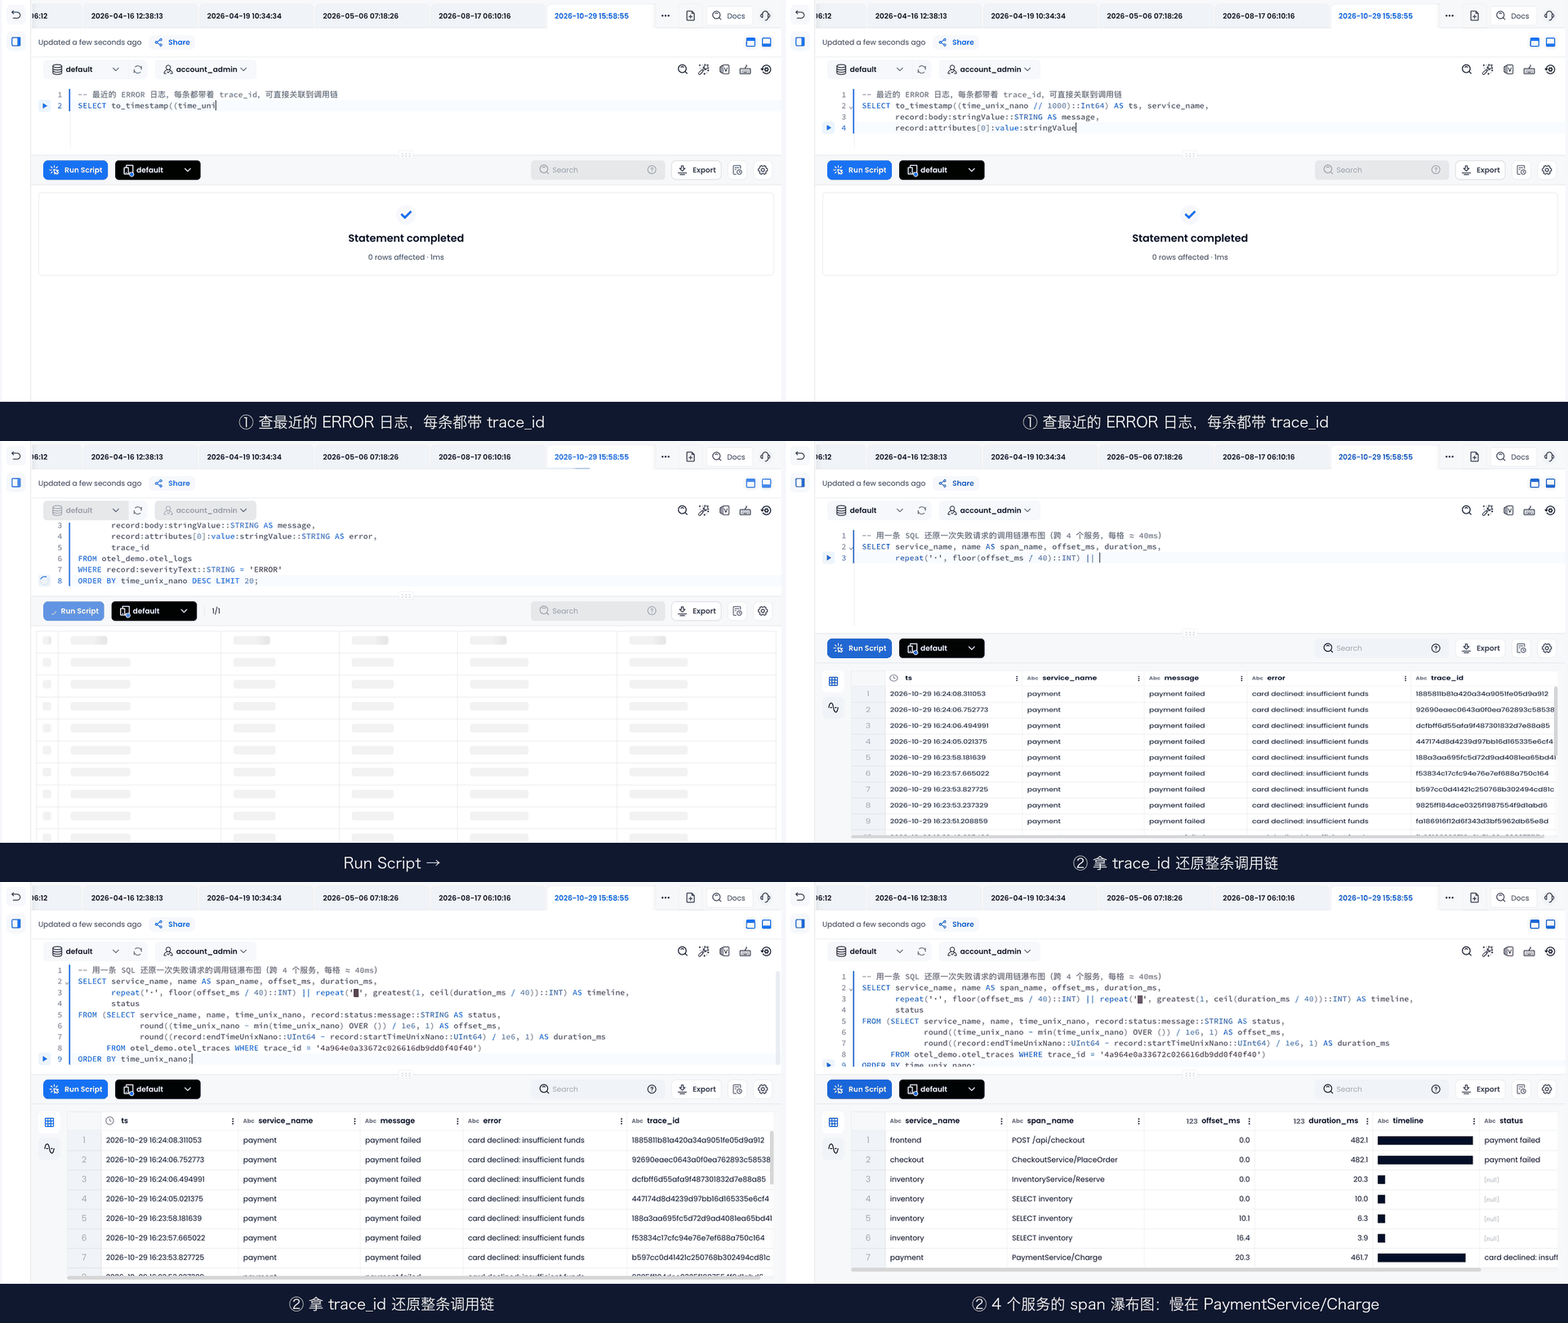
Locate Payment Errors from Logs
SELECT to_timestamp((time_unix_nano // 1000)::Int64) AS ts, service_name,
       record:body:stringValue::STRING AS message,
       record:attributes[0]:value:stringValue::STRING AS error,
       trace_id
FROM otel_demo.otel_logs
WHERE record:severityText::STRING = 'ERROR'
ORDER BY time_unix_nano DESC LIMIT 20;
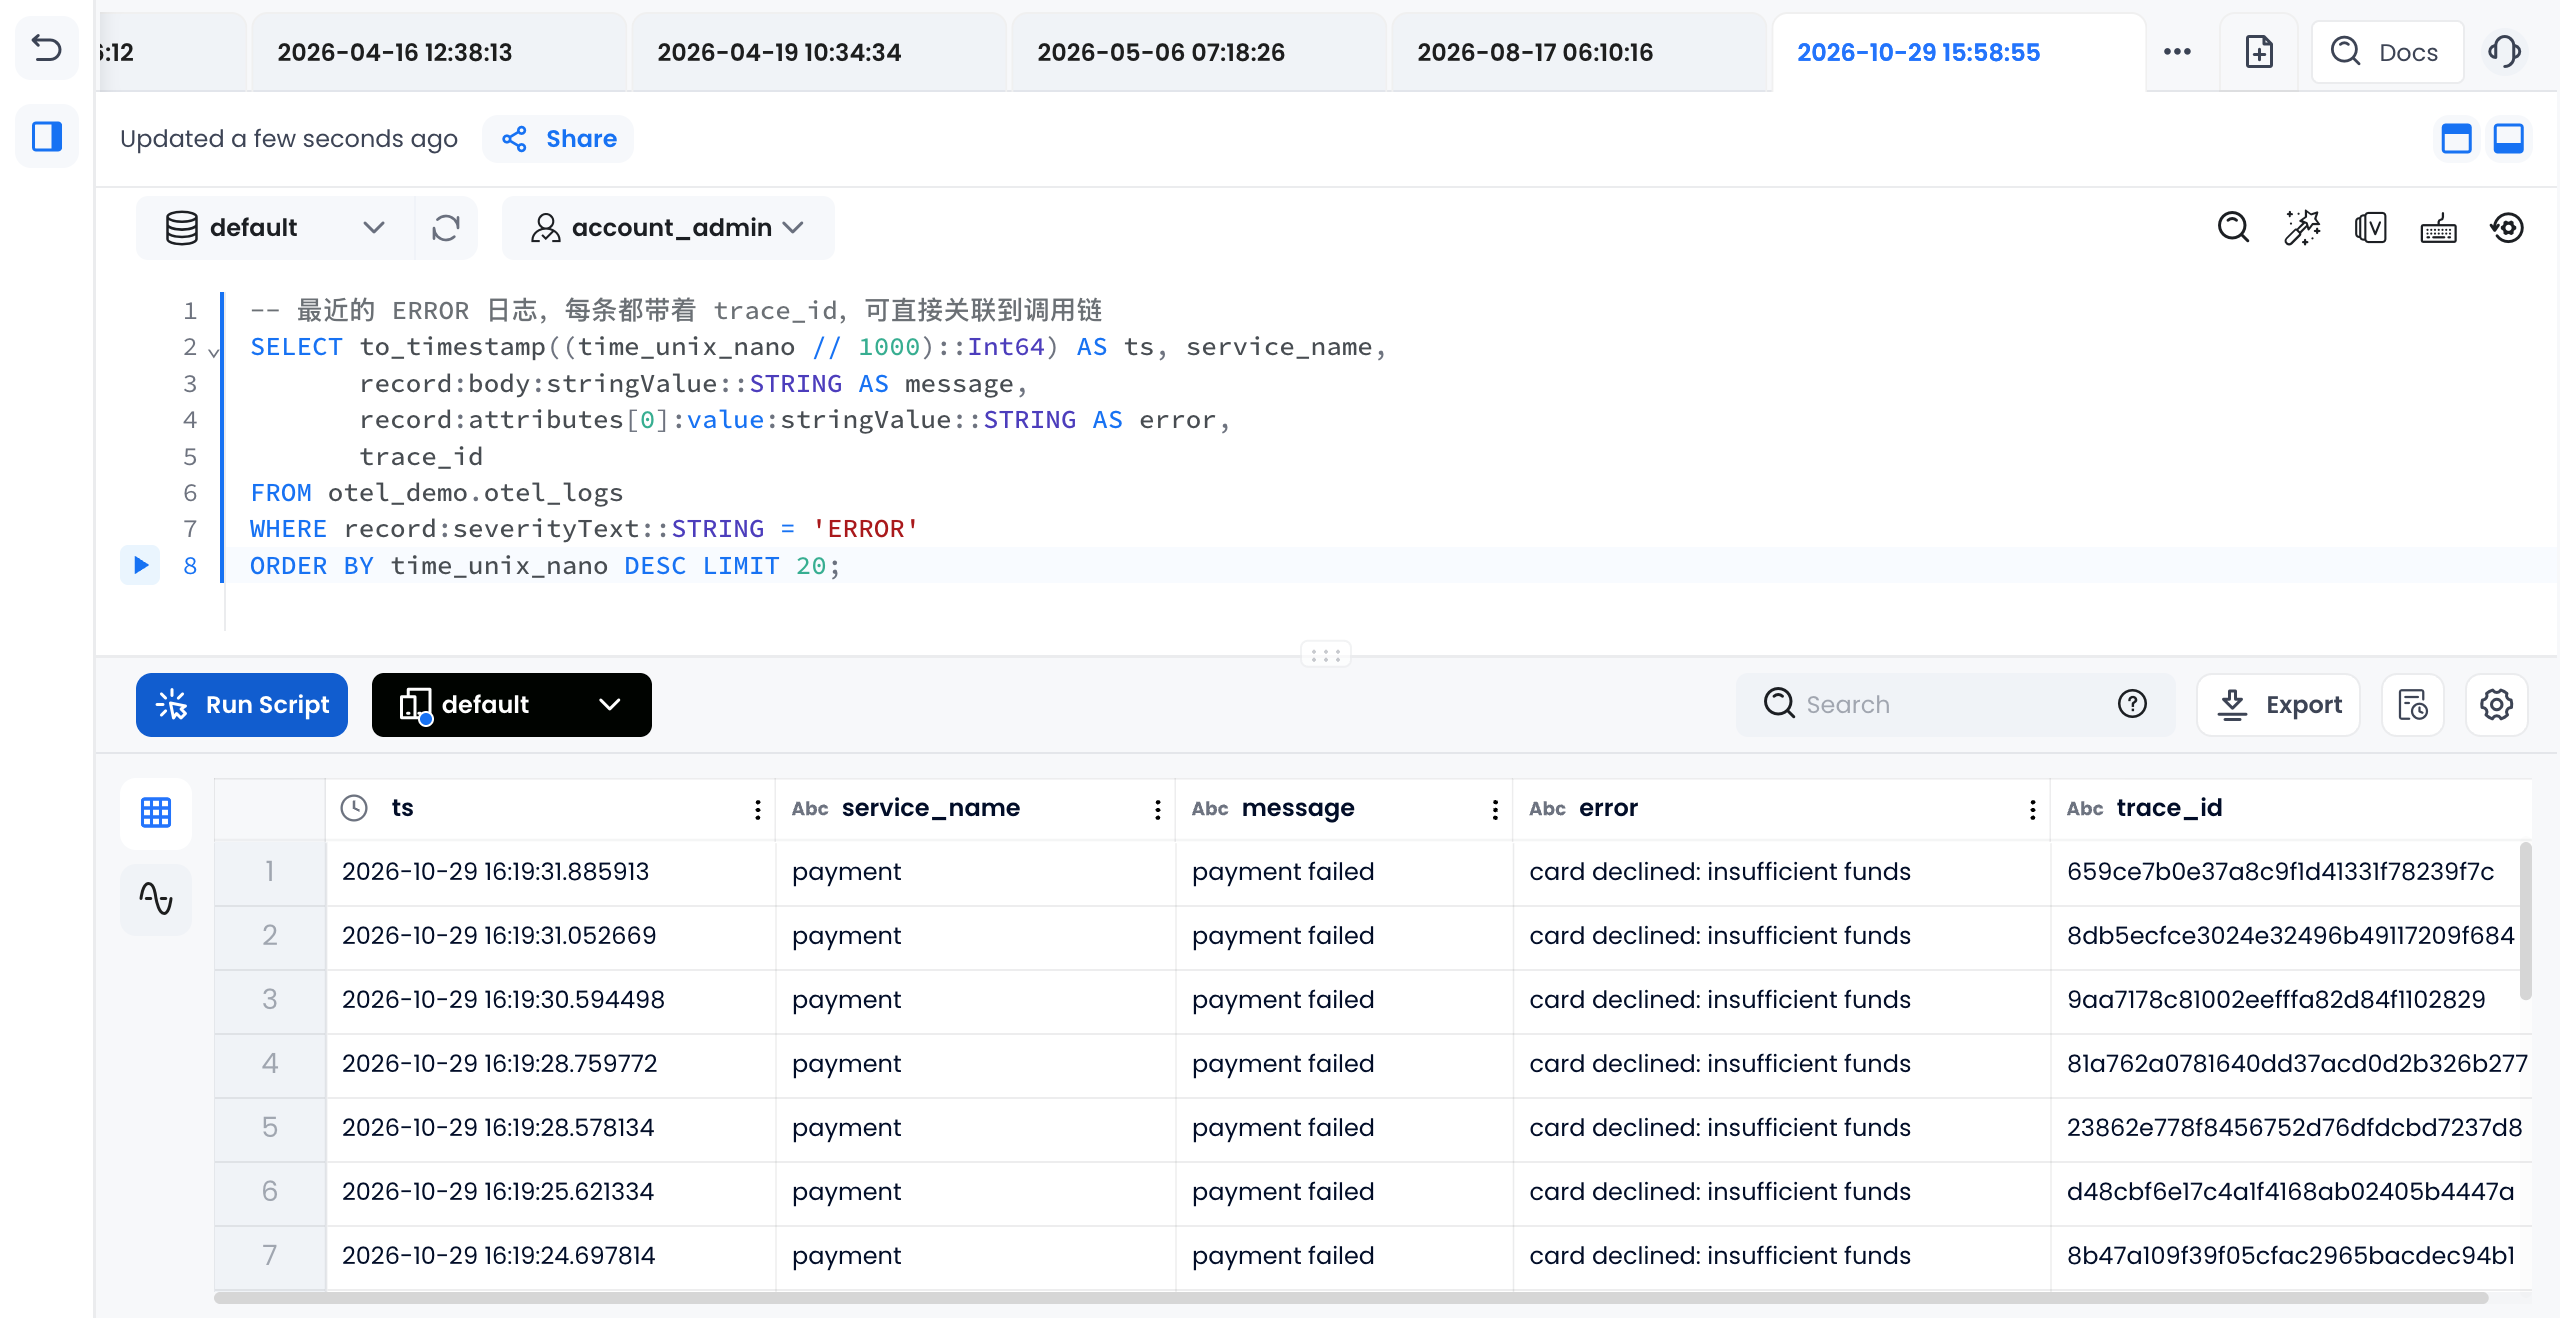
The errors are concentrated in the payment service, with the message card declined: insufficient funds. In this example, the OTel SDK writes the current span context into logs, so you can continue to find the corresponding trace using the trace_id from the log.
Reconstruct the Request Call Chain with trace_id
Select a trace_id from the logs and query all spans for that request, then use repeat() to draw a text-based waterfall chart:
SELECT service_name, name AS span_name, offset_ms, duration_ms,
       repeat('·', floor(offset_ms / 40)::INT)
         || repeat('█', greatest(1, ceil(duration_ms / 40))::INT) AS timeline,
       status
FROM (SELECT service_name, name, time_unix_nano,
             record:status:message::STRING AS status,
             round((time_unix_nano - min(time_unix_nano) OVER ()) / 1e6, 1) AS offset_ms,
             round((record:endTimeUnixNano::UInt64
                    - record:startTimeUnixNano::UInt64) / 1e6, 1) AS duration_ms
      FROM otel_demo.otel_traces WHERE trace_id = '<trace_id>')
ORDER BY time_unix_nano;
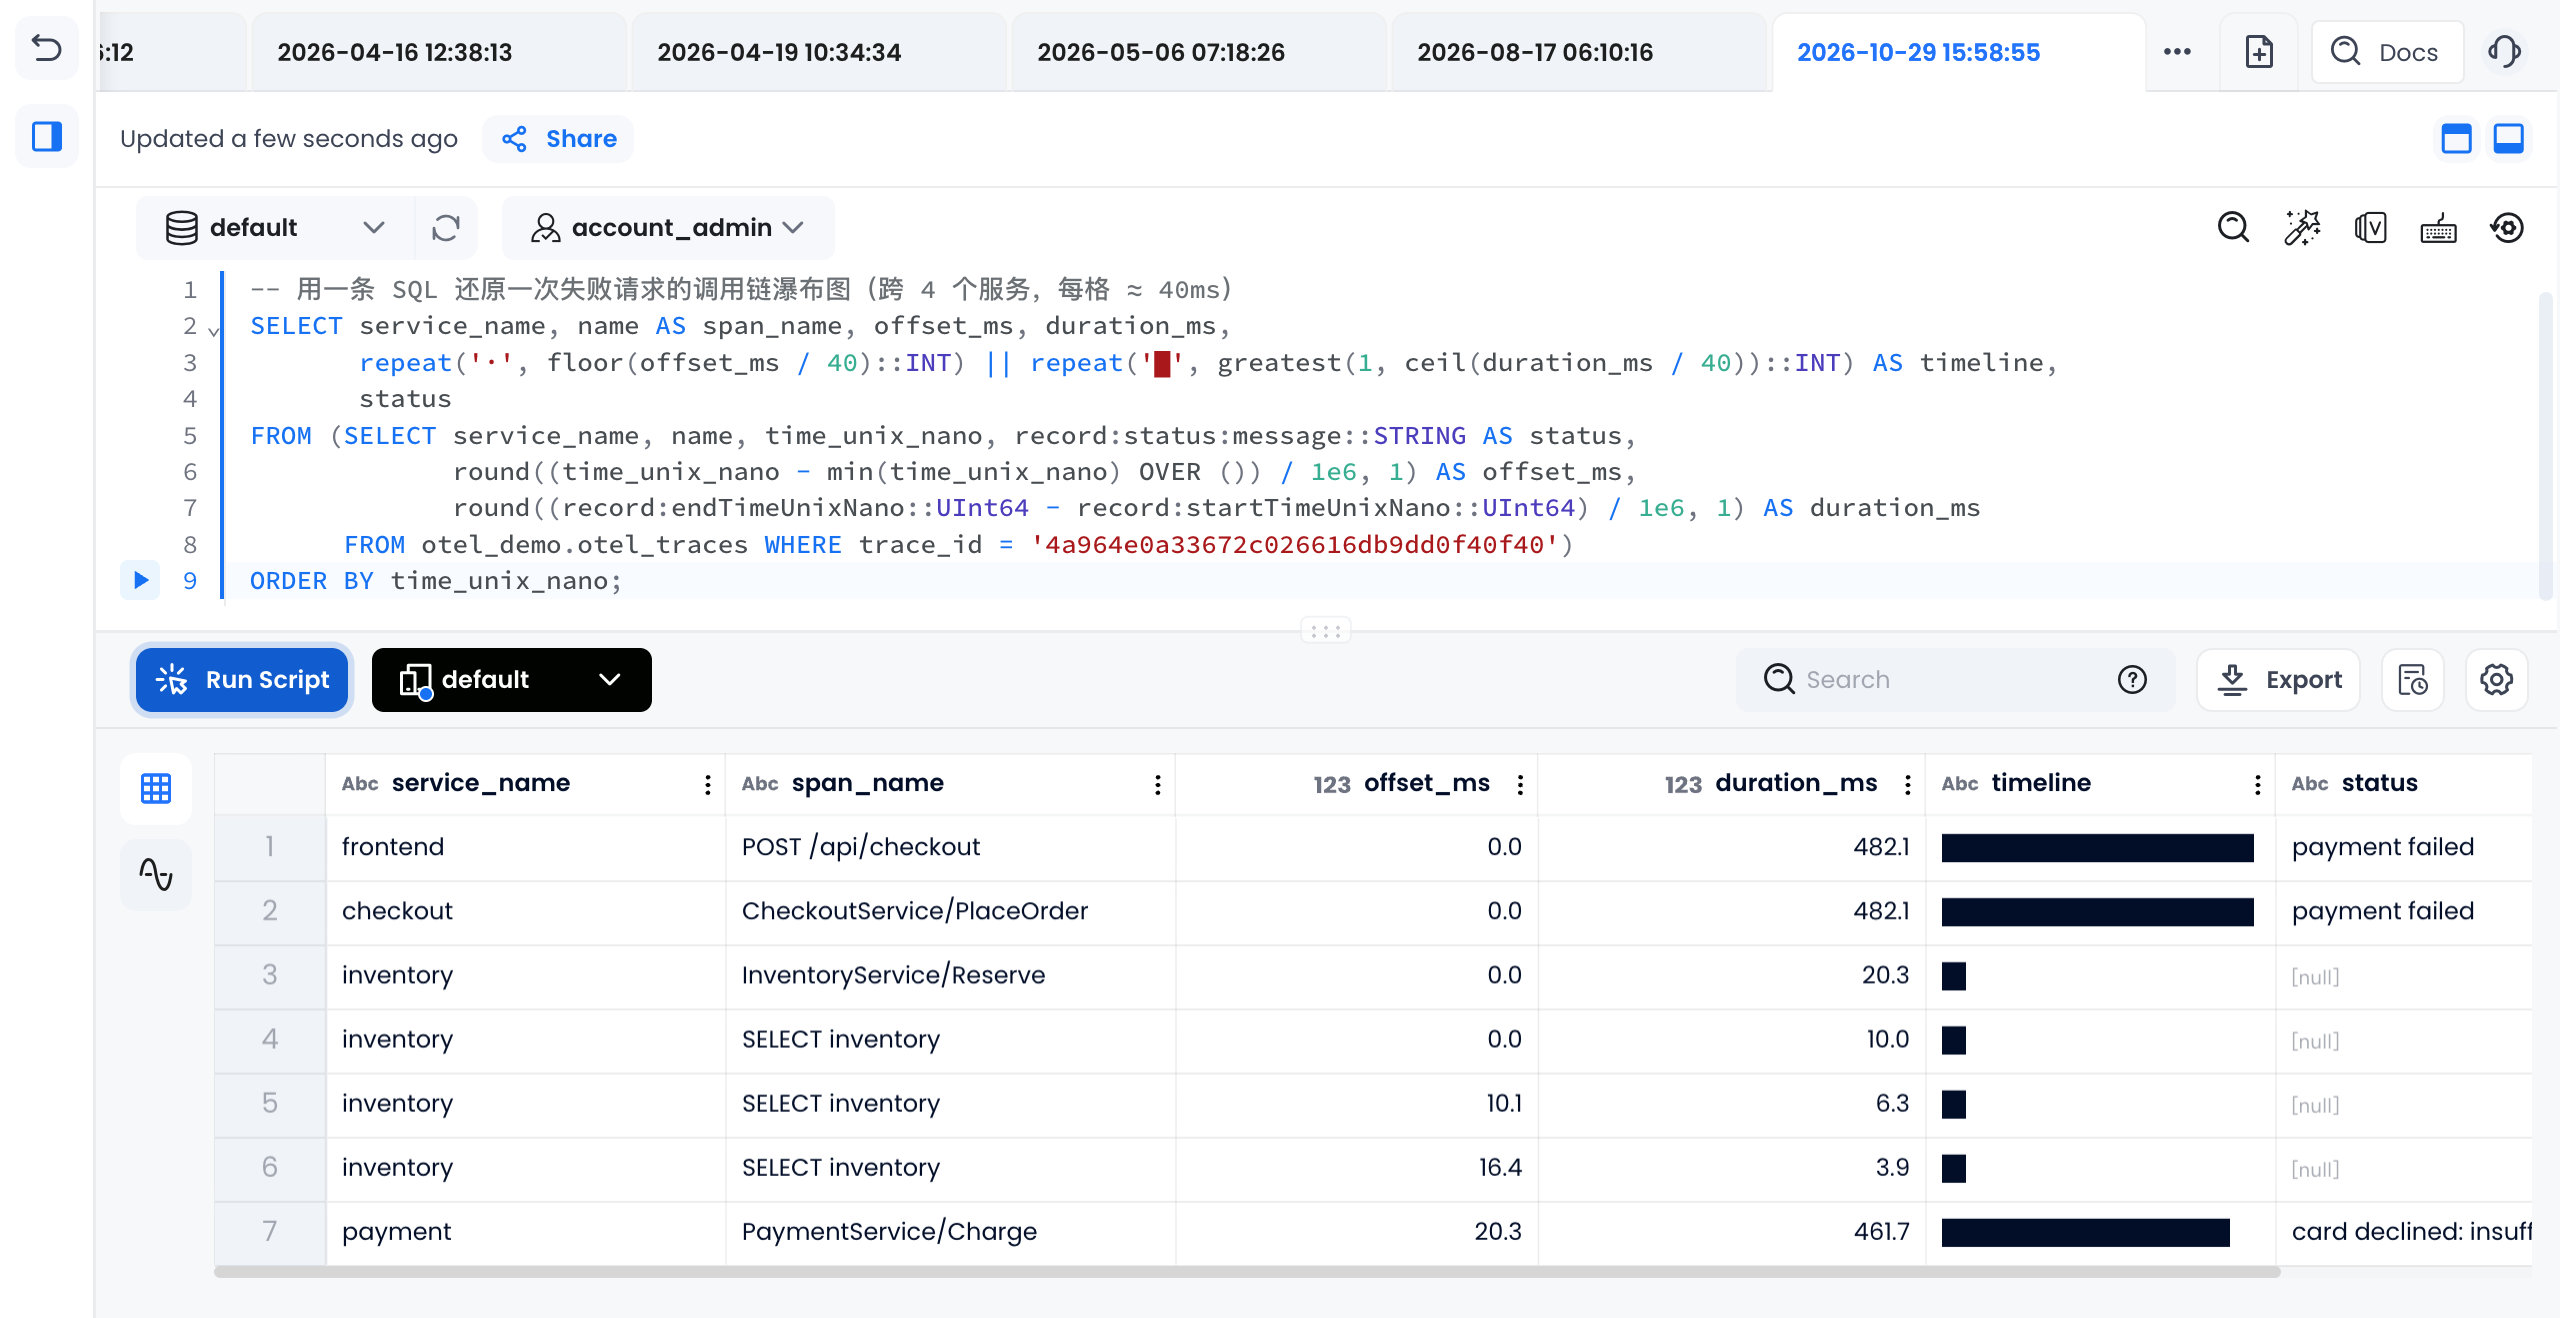
This request had a total duration of 482 ms, inventory check took 20 ms, and PaymentService/Charge took 462 ms before eventually failing. The time is mostly spent in the payment step.
Calculate P95 Latency and Error Counts per Service
You can compute latency and error counts directly from spans, without pre-defining metrics for this query:
SELECT service_name, name AS span_name, count(*) AS spans,
       round(avg(dur_ms), 1) AS avg_ms,
       round(quantile_cont(0.95)(dur_ms), 1) AS p95_ms,
       sum(if(record:status:code::INT = 2, 1, 0)) AS errors
FROM (SELECT *, (record:endTimeUnixNano::UInt64
                 - record:startTimeUnixNano::UInt64) / 1e6 AS dur_ms
      FROM otel_demo.otel_traces)
GROUP BY service_name, span_name
ORDER BY p95_ms DESC;
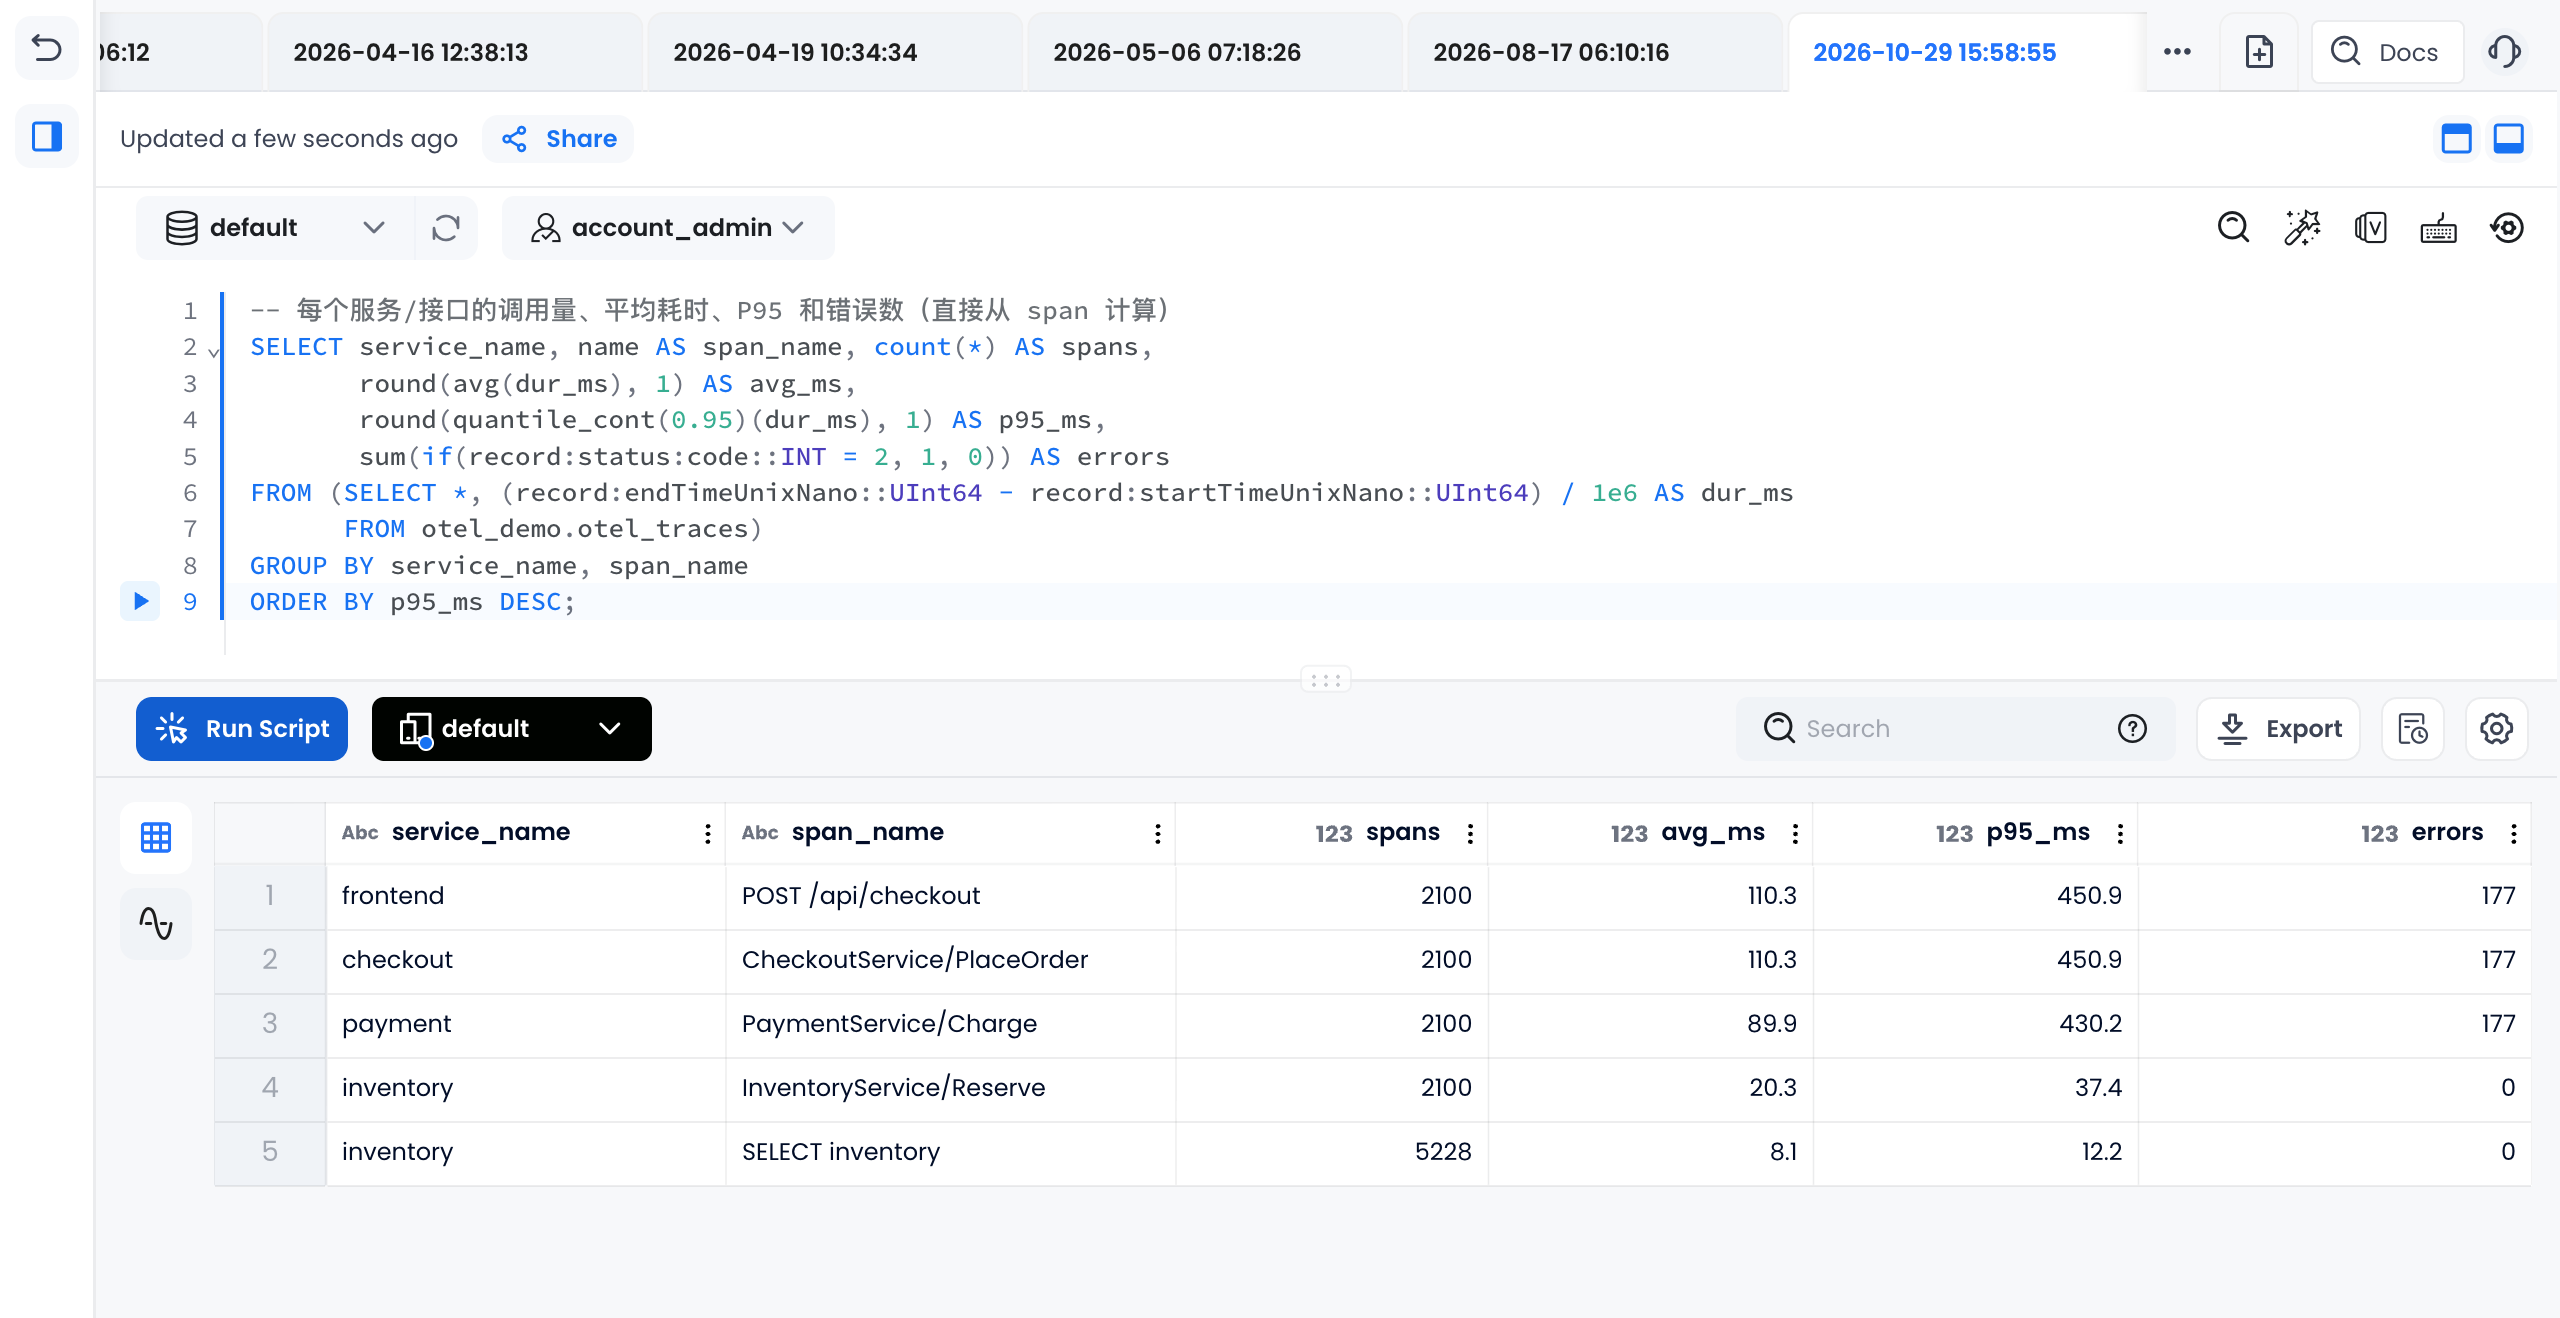
The P95 latency for the checkout endpoint is 450.9 ms, for the payment step it's 430.2 ms, and inventory has a P95 of only 37.4 ms.
Correlate Logs and Traces, and Calculate Failed Order Amounts
Next, you can analyze technical failure and business impact together. In this example, logs record the order amount, spans record processing time, and you can join them via trace_id and span_id:
SELECT l.service_name,
       l.record:attributes[0]:value:stringValue::STRING AS error,
       count(*) AS failed_orders,
       round(avg((t.record:endTimeUnixNano::UInt64
                  - t.record:startTimeUnixNano::UInt64) / 1e6), 1) AS avg_charge_ms,
       round(sum(l.record:attributes[1]:value:doubleValue::DOUBLE), 2) AS lost_revenue_usd
FROM otel_demo.otel_logs l
JOIN otel_demo.otel_traces t ON l.trace_id = t.trace_id AND l.span_id = t.span_id
WHERE l.record:severityText::STRING = 'ERROR'
GROUP BY ALL;
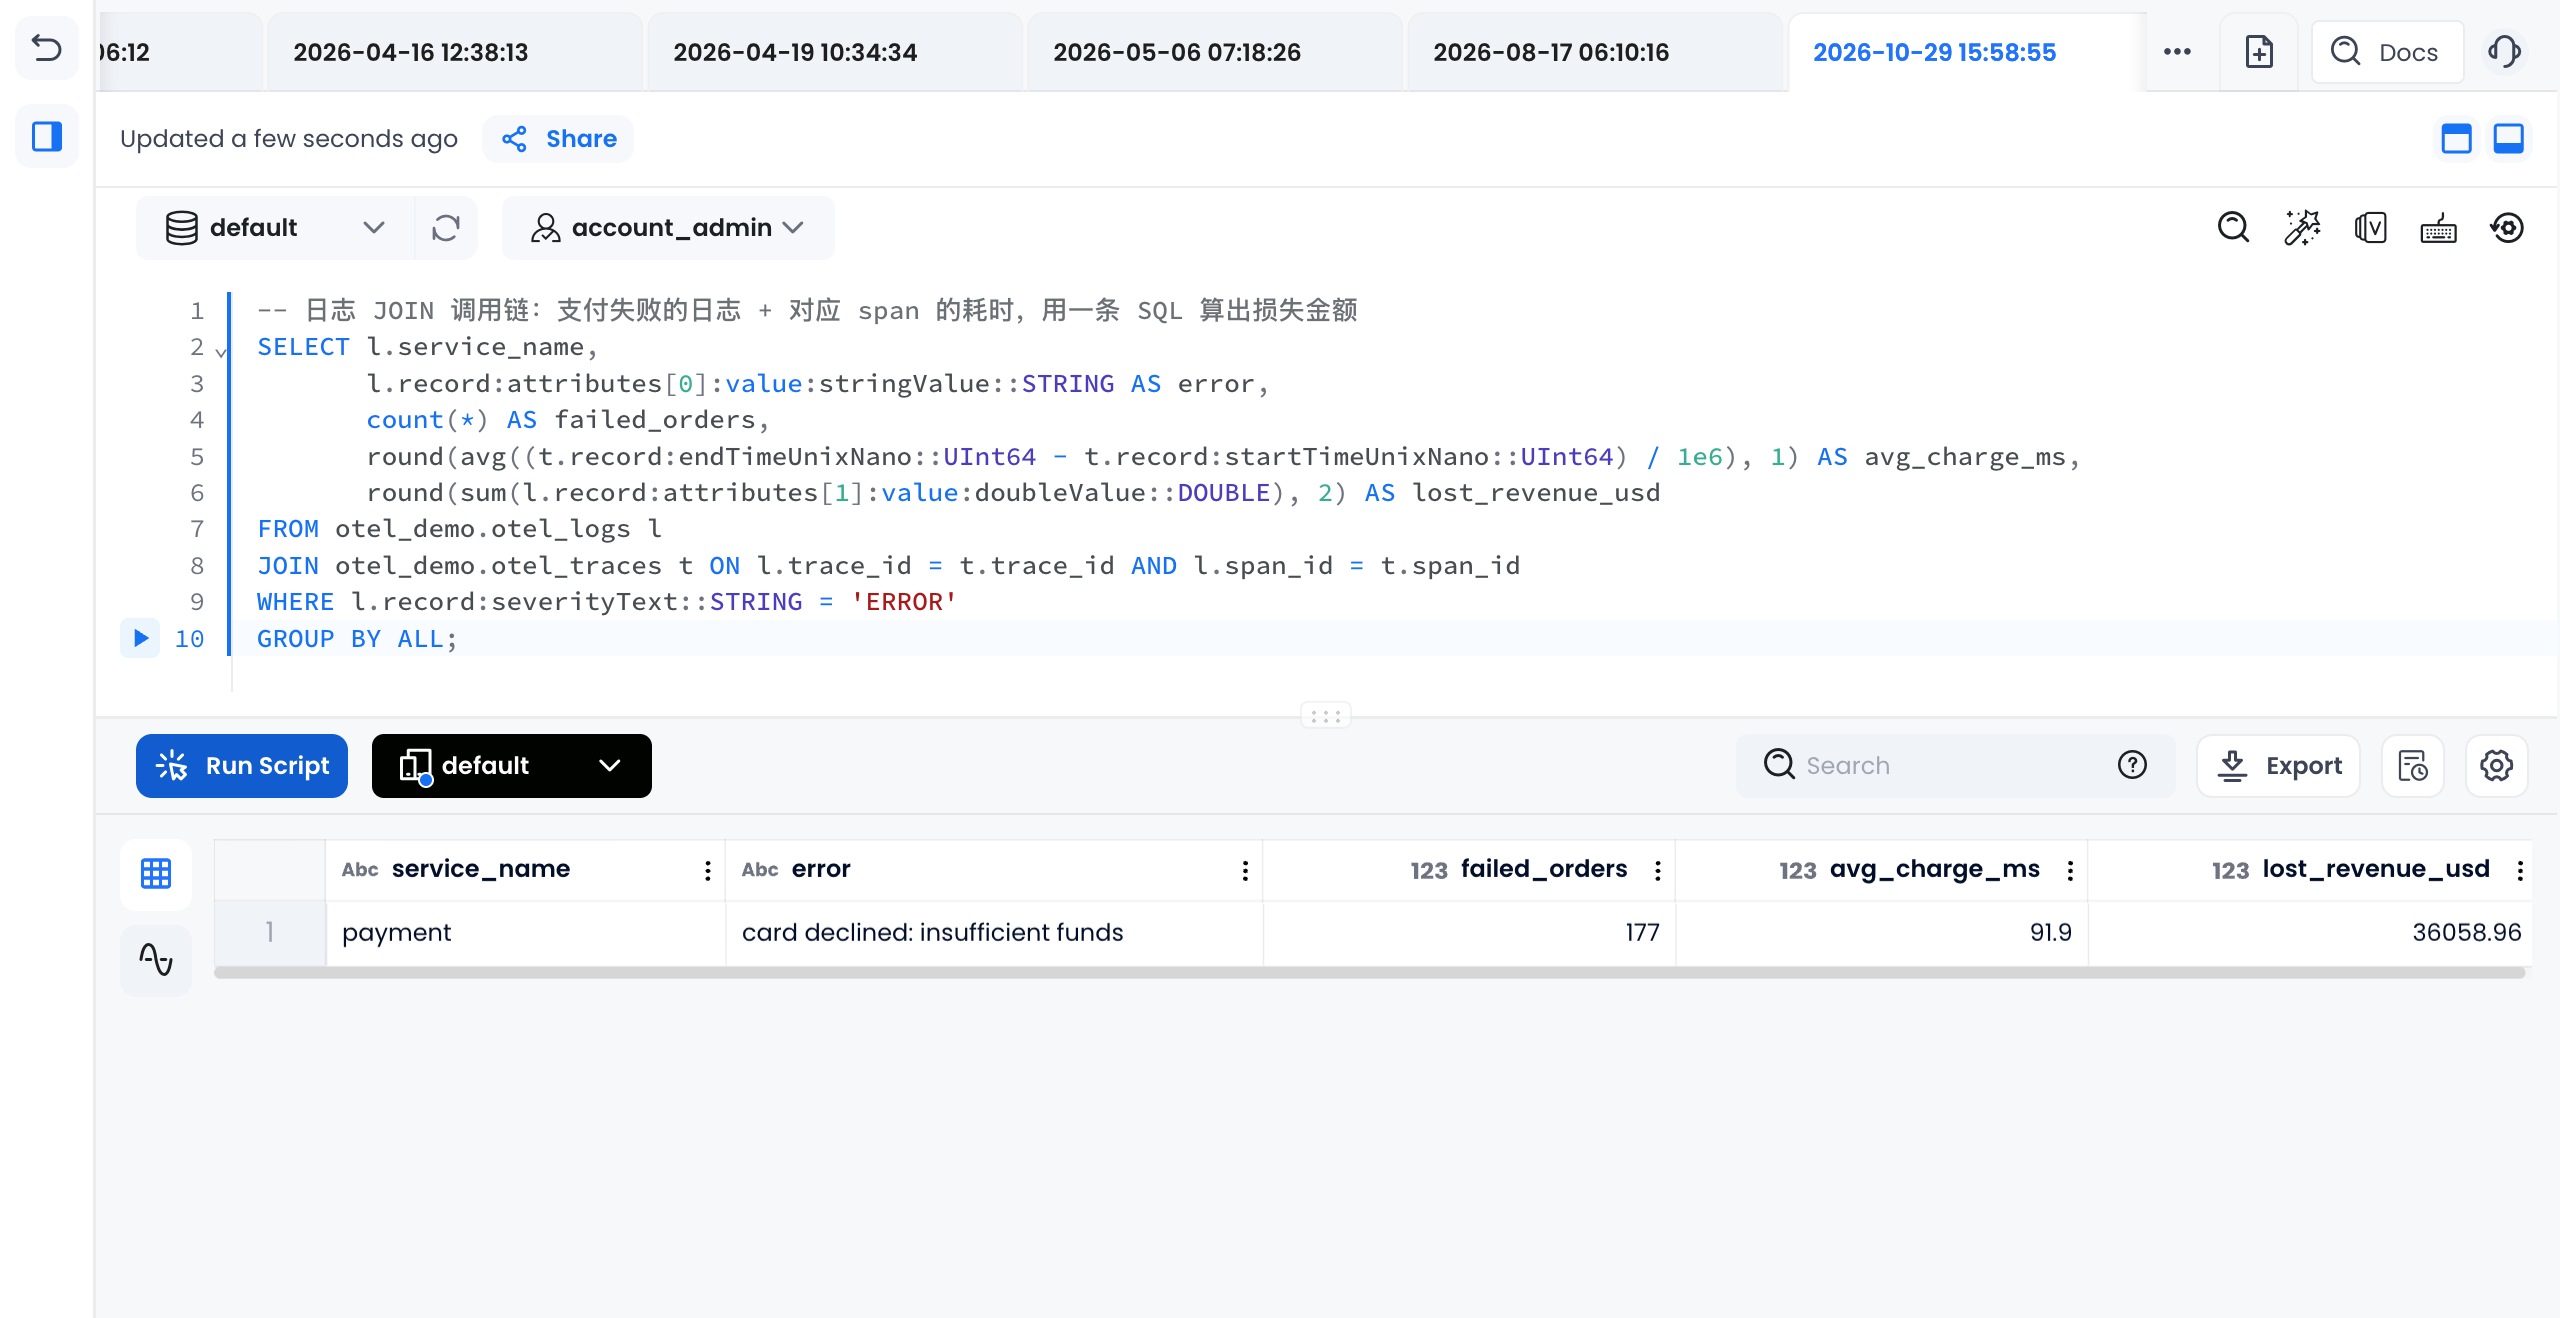
In this simulation, 177 orders did not complete due to charge failures, involving $36,058.96. Once logs and traces are stored in Databend Cloud, a single JOIN brings failure cause, order amount, and payment latency into one result set. If the order table is also in Databend Cloud, you can continue analyzing impact by user, channel, or product.
View Histogram Metrics and Correlate Traces
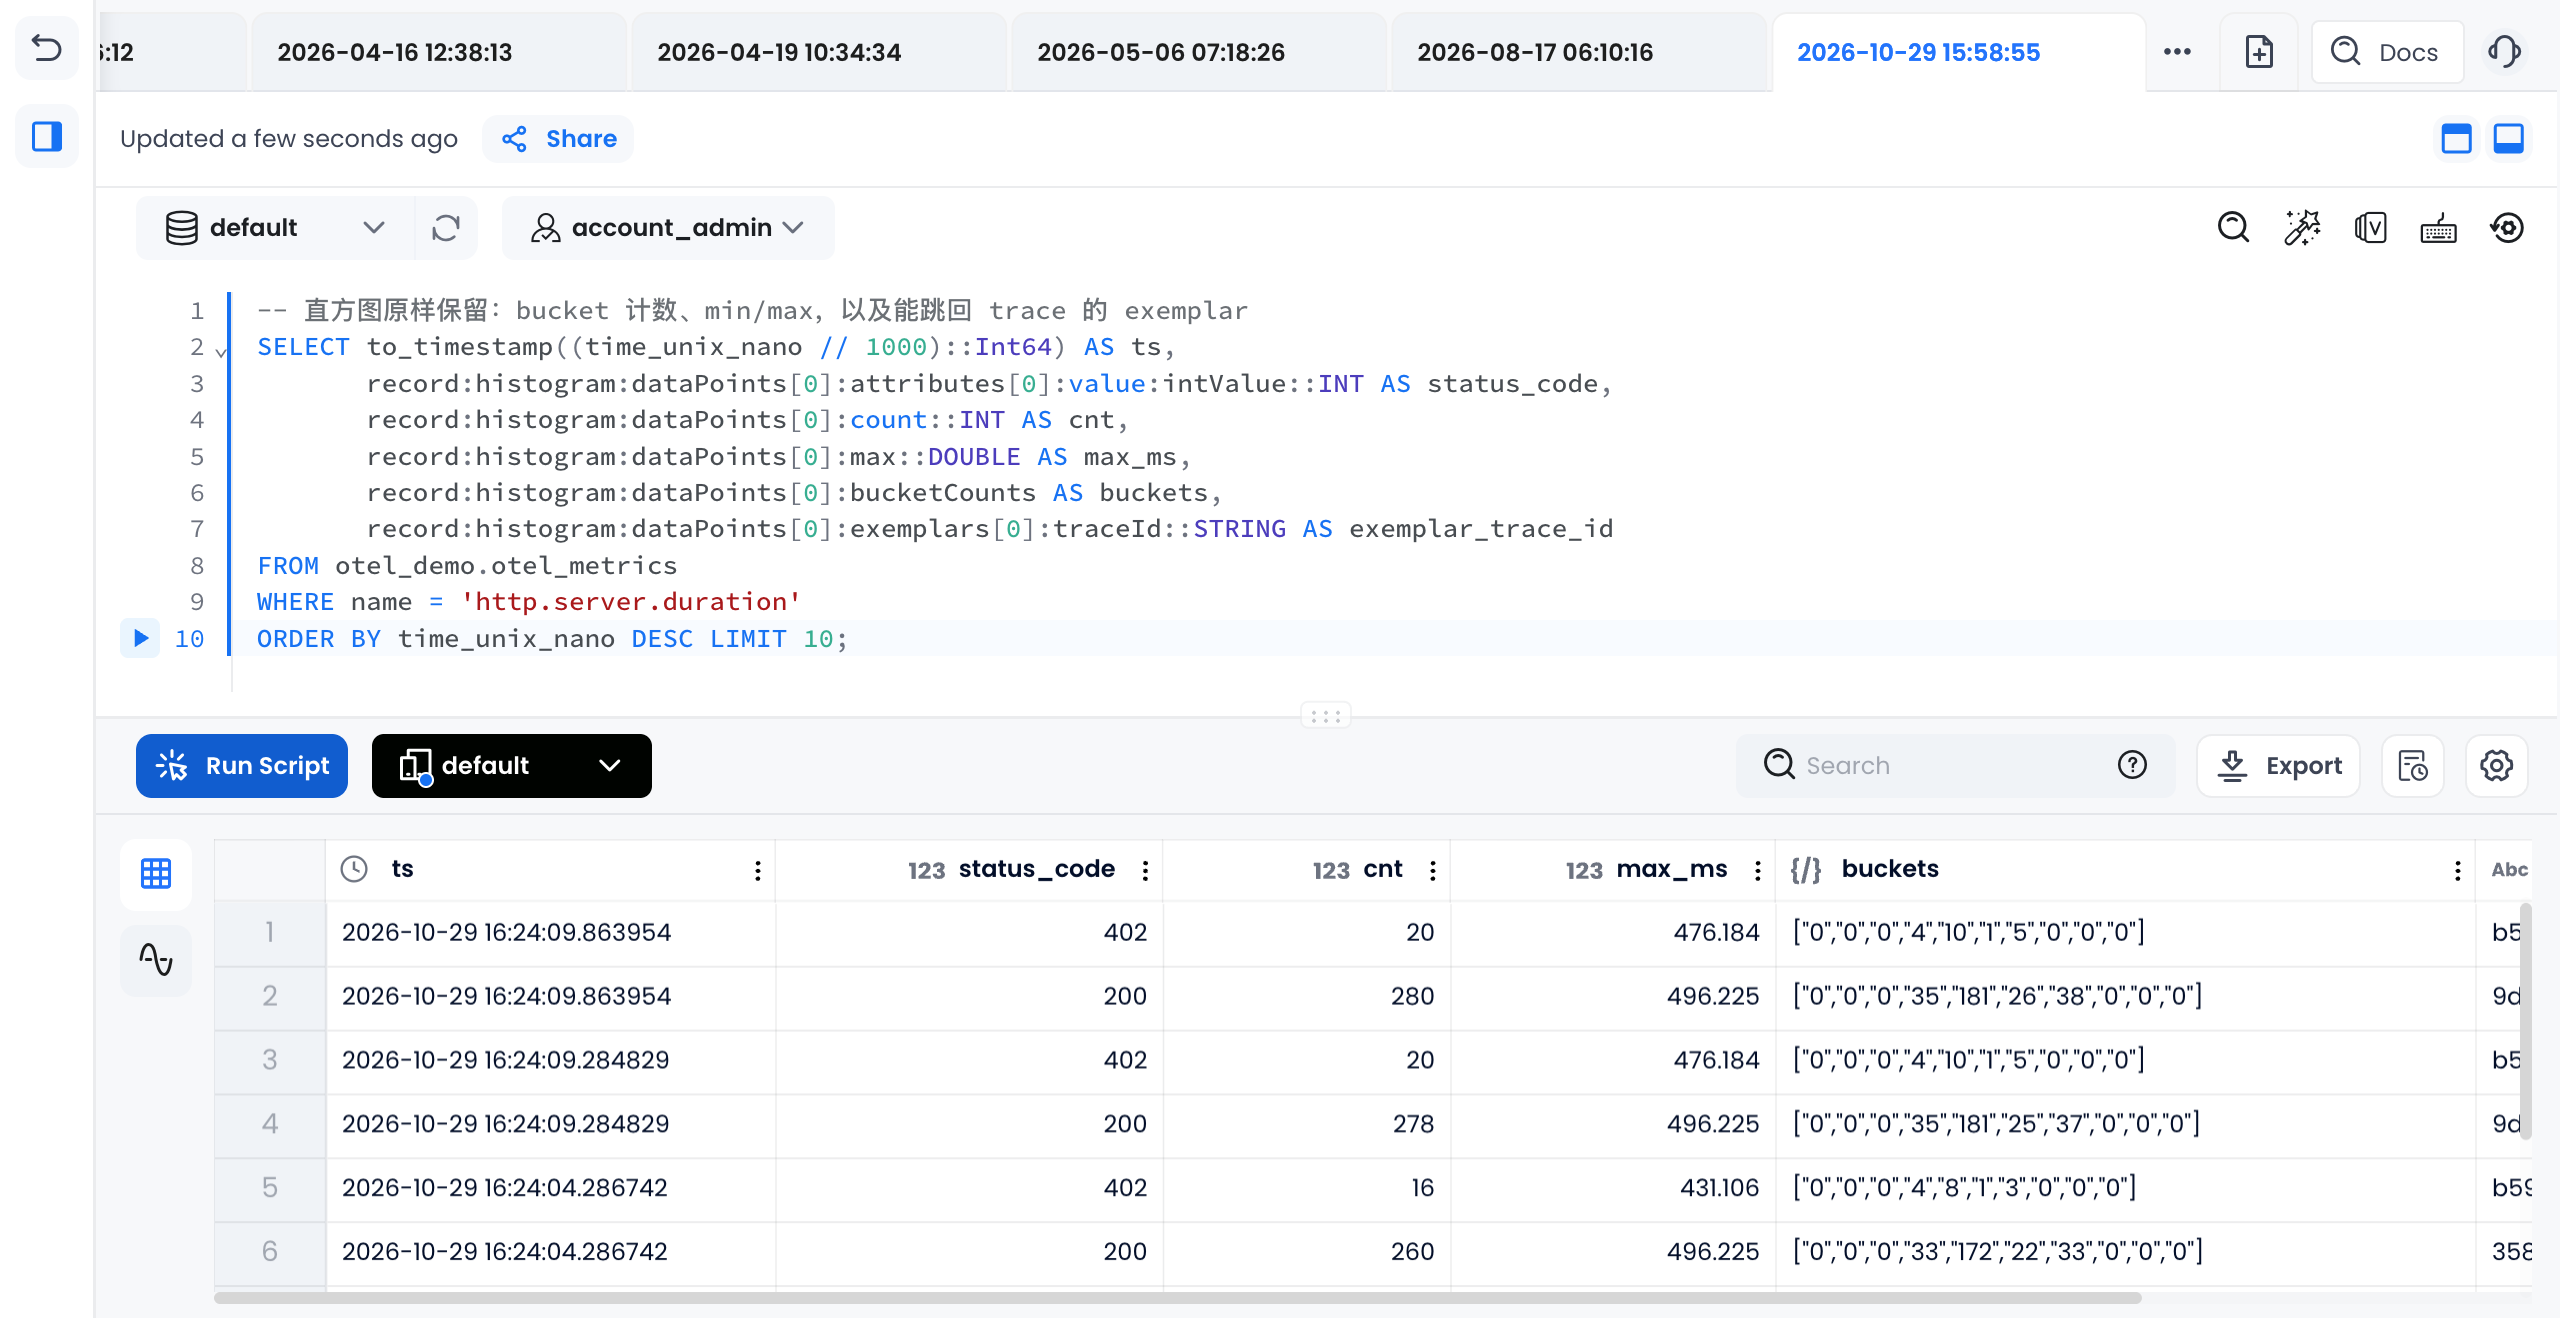
Each row in the metrics table corresponds to a data point, preserving the bucket counts, boundaries, and min/max of the histogram. The trace_id in an exemplar can also be used to query the corresponding request chain for that sample.
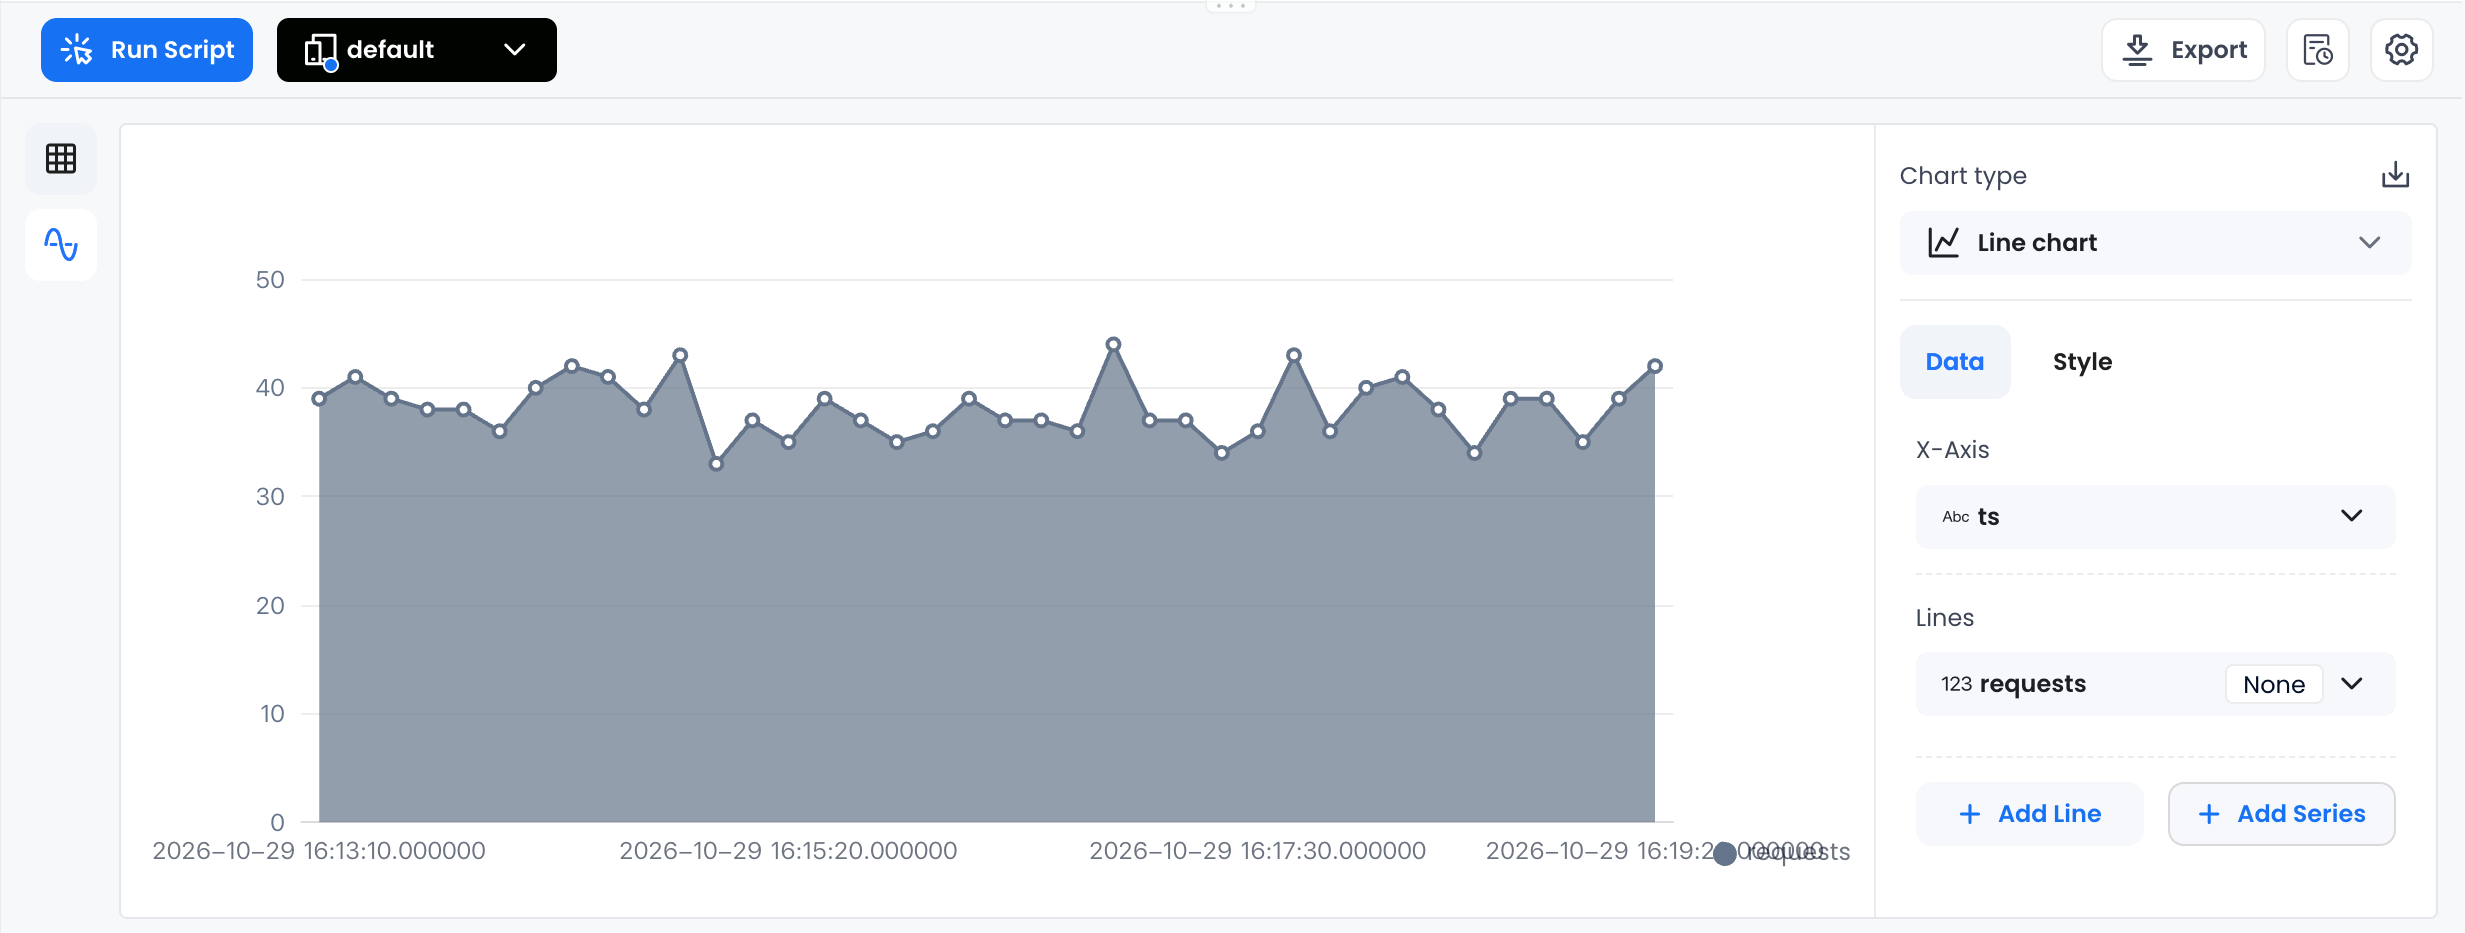
Turn Query Results into a Request Volume Trend Chart
The Worksheet supports switching query results to chart view. The image below shows request volume for the checkout endpoint over a 10-second window:
What Does Bringing Observability Data into a Lakehouse Bring?
Databend is a cloud-native lakehouse that stores data on object storage, separates compute from storage, and provides SQL analysis capabilities. Structured business tables and semi-structured logs and traces can be queried on the same platform. Databend Cloud is a managed service that lets teams configure compute resources per workload. This architecture provides a basis for long-term retention and correlation analysis of observability data.
Combined with the demo, what users value more is what can be done after data is written. When troubleshooting a payment failure, we can already see error cause, processing time, and failed order amount in a single query. If business data is also in Databend Cloud, you can subsequently analyze which users and channels were affected without exporting logs to another analysis system.
For data engineers, observability data can be included in daily analysis alongside business data. To make such analysis convenient, you need both a unified query method and consideration of data retention, schema changes, and integration with existing tools. Databend Cloud provides support in these areas:
All three signal types use the same SQL. After logs, traces, and metrics are written into the same engine, you can query and correlate them via trace_id, span_id, or service name, reducing the work of cross-system information comparison. The join of logs and traces above is a direct example.
Direct correlation with existing business tables. When order, user, and billing data are already in Databend Cloud and have usable correlation fields, you can use SQL to analyze business impact without exporting and moving data for each investigation. Analysis can extend from a single incident to the distribution of failures over a period.
Configure resources separately for retention period and query load. Object storage holds historical data, and compute resources are allocated based on write and query needs. Teams can decide the retention period for logs and traces based on postmortems, capacity planning, or audit requirements, avoiding the need to scale compute just because historical data grows. Actual costs still depend on data volume, retention period, and read/write load.
Retain dynamic attributes and extract fields as needed for analysis. OTel attributes change with services and versions. The VARIANT column can store such semi-structured content. When querying, you extract values via paths like record:attributes and record:status:code. New attributes usually do not require table schema changes, and raw information is preserved for later analysis.
Reuse existing OTel collection methods. For applications already sending data via OTLP to a Collector, connecting to Databend Cloud mainly involves adding an exporter and pipeline configuration. If you need to write to other backends simultaneously, you can configure multiple exporters, preserving existing monitoring workflows.
Continue using familiar analysis tools. Data is stored as regular tables, queryable via BI tools that support Databend. The Databend Grafana data source plugin also supports using SQL to configure dashboards and alerts. If you want AI agents to assist with queries, you can reuse these tables and SQL interfaces.
Component Status and Usage Boundaries
The exporter used in this demo is a standalone component in the development stage and has not yet entered the official OpenTelemetry Collector Contrib distribution. The team plans to donate it after collecting community feedback. Be aware of the following boundaries:
Delivery semantics are at-least-once: if a write is committed but the connection breaks before returning, retries may produce duplicate rows, and there is currently no deduplication.
Queue overflow, retry exhaustion, or abnormal process exit (when persistent queue is not enabled) can lead to data loss. In production, it is recommended to enable the persistent queue and configure batch and memory_limiter.
Table structure changes are the operator's responsibility;
CREATE TABLE IF NOT EXISTSdoes not migrate existing tables; there is no automatic TTL.The Profiles signal is not supported yet.
Unit tests for the current demo version include race detection, with coverage at 90.4%. CI spins up a real Databend instance to run end-to-end tests, verifying the five metric types, nanosecond timestamps, and integer precision. This demo ran completely on Databend Cloud (v1.2.952).
Get the Code and Demo Resources
Code and documentation: github.com/databendlabs/opentelemetry-exporter-databend
The demo code, all SQL, and Collector configuration for this article are in the
demo/directory of the repository. Feel free to try it out and provide feedback via Issues or PRs. If you've already integrated it in production, we welcome sharing data scale and use cases to help determine future optimization directions.